The era of mobile computing, catalyzed by Apple and Google, is driving among the largest shifts in consumer behavior over the last forty years. Impressively, its rate of adoption is outpacing both the PC revolution of the 1980s and the Internet Boom of the 1990s. Since 2007, more than 500 million iOS and Android smartphones and tablets have been activated. By the end of 2012, Flurry estimates that the cumulative number of iOS and Android devices activated will surge past 1 billion. According to IDC, over 800 million PCs were sold between 1981 and 2000, making the rate of iOS and Android smart device adoption more than four times faster than that of personal computers.
Powerfully, smartphones and tablets come with broadband connectivity out-of-the-box, instantly combining the best of “Silicon” and “The Cloud” for consumers. The Internet, which served to connect the installed base of PCs, grew to 495 million users by the end of 2001, according to the International Telecommunication Union. With the Internet beginning its commercial ramp in 1996, iOS and Android devices will see double the number of device activations during its first five years compared to the number of Internet users reached during its first five years (Internet 1996 – 2001 vs. Smart devices 2007 – 2012).
On top of this massively growing iOS and Android device installed base, roughly 40 billion applications have already been downloaded from the App Store and Android Market. More than ever, consumers are splitting their time accessing services on the Internet from PCs versus doing so on mobile devices from apps. Last summer, Flurry published a report detailing how the average smartphone user, for the first time ever, began spending more time in their mobile applications than they do browsing the web. Updating the analysis, Flurry finds the usage gap continues to widen. Let’s look at the updated numbers.
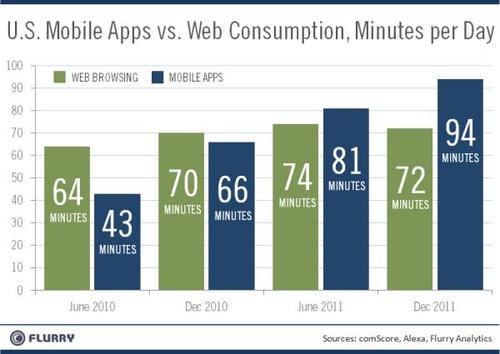
The chart compares how daily interactive consumption has changed over the last 18 months between the web (both desktop and mobile web) and mobile native apps. For the web, shown in green, we built a model using publicly available data from comScore and Alexa. For mobile application usage, shown in blue, we used Flurry Analytics data, which tracks anonymous sessions across more than 140,000 applications. We estimate this accounts for approximately one third of all mobile application activity, which we scaled-up accordingly for this analysis.
Since conducting our first analysis in June 2011, time spent in mobile applications has grown. Smartphone and tablet users now spend over an hour and half of their day using applications. Meanwhile, average time spent on the web has shrunk, from 74 minutes to 72 minutes. Users seem to be substituting websites for applications, which may be more convenient to access throughout the day.
Our analysis shows that people are now spending less time on the traditional web than they did during the summer 2011. This drop appears to be driven largely by a decrease in time spent on Facebook from the traditional web. In June 2011, the average Facebook user spent over 33 minutes on average per day on the website. Now, that number is below 24 minutes. Time spent on the web without Facebook has grown at a modest rate of 2% between June 2011 and December 2011.
The analysis also shows that people are spending ever more time in applications. In fact, time spent in apps and the web, combined, has grown as users lead a more connected life. This growth though has been driven entirely by applications. The growth in time spent in mobile applications is slowing – from above 23% between December 2010 and June 2011 this year to a little over 15% from June 2011 to December 2011. The growth is predominately being driven by an increase in the number of sessions, as opposed to longer session lengths. Consumers are using their apps more frequently.
Based on our analysis, we believe that Facebook users, and users of other traditional style websites, are increasingly accessing services through mobile applications than from desktops. Nielsen recently reported that Facebook is the most used app on Android among 14 – 44 year olds, surpassing usage of Google’s own native, pre-installed apps. Additionally, Facebook Messenger became the top downloaded app, at least one time during 2011, across more than 100 different App Store countries. In the U.S., the largest App Store market, Facebook Messenger ranked as the top overall app across most of the holiday week, during which more downloads occur compared to any other week.
With Facebook’s recent push into HTML5 with Project Spartan, where apps built for Facebook’s platform can run on top of the Facebook app, instead of requiring the user to launch the iOS app equivalent, this poses a disintermediation challenge to Apple. As Apple and Google continue to battle for consumers through the operating system and devices, Facebook is demonstrating that it can leverage its hold over consumers at the software level, through the power of the social network, across multiple platforms.
Facebook and Google are already locked in a battle for the online consumer, with Facebook having steadily taken share from the search engine giant over the last several years. Recently, as Google countered with its socially-oriented Google Plus, Circles and Hangouts services, Facebook added features such as news feeds to further lock in consumers to its service by obviating the need to discover content through search.
Likewise, Apple’s recently launched iCloud service, which allows consumers to store their most personal content, including music, photos and contacts, as well as its deep integration with social-service, Twitter, appears to buttress against Facebook’s ability to control the consumer relationship. With games as the top app category across Facebook, iOS and Android, as well as having become increasingly social in nature, Facebook is countering to reclaim valuable game play sessions it earned from its own platform play launched in 2007, rather than simply surrendering them to iOS and Android, who have effectively wooed consumers off of the web platform to mobile apps.
With mobile app usage soaring, Flurry additionally studied which categories most occupy consumers’ time. The results are shown in the pie chart below.
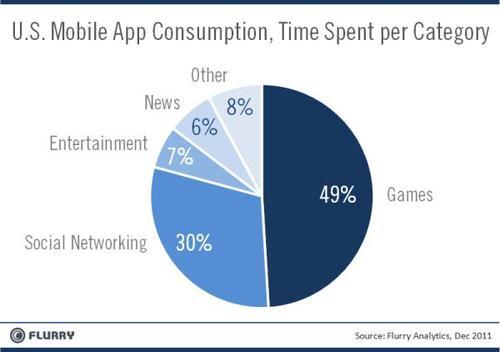
The chart clearly shows that Games and Social Networking categories capture the significant majority of consumers’ time. Consumers spend nearly half their time using Games, and a third in Social Networking apps. Further considering that Flurry does not track Facebook usage, the Social Networking category is actually larger. Combined, from just what Flurry can see, these two categories control a whopping 79% of consumers’ total app time. This breakdown in usage reveals Facebook’s inherent popularity as the leading social network, as well as how important controlling the game category is for all platform providers. As we drill down into the category data, consumers use these two categories more frequently, and for longer average session lengths, compared to other categories.
Any way we slice it, Games and Social Networking apps deliver the most engaging experience on the web and mobile today, and set the stage for the battleground for controlling the consumer relationship going forward for all platform providers on all platforms.