The last week of the year, from December 25 through December 31, sees more iOS and Android device activations compared to any other week of the year. Starting with Christmas Day, the largest single device activation day of the year, the week between Christmas and New Year’s Day is filled with significantly elevated device activations and app downloads. For application makers, this holiday “power week” is far more important than the run-up to Christmas itself. This report reveals that the last week of 2011 was the largest week for device activations and app downloads in iOS and Android history.
For this report, Flurry leverages its data-set from over 140,000 apps running on the significant majority of iOS and Android devices. With its application penetration, Flurry can detect over 90% of all new devices activated each day. Additionally, with its analytics service in more than 20% of all applications downloaded on a given day from the App Store and Android Market, Flurry can reliably estimate total iOS and Android downloads. To benchmark against the market, Flurry regularly triangulates its device and download figures with data released publicly by Google and Apple.
In its most recent report, Flurry estimated that a record-breaking 6.8 million iOS and Android devices were activated on Christmas Day, along with an equally record-breaking 242 million application downloads. Studying the data from December 25 – December 31, additional records were set, now for the highest number of device activations and app downloads of any week in history. Over the holiday “power week,” Flurry estimates that over 20 million iOS and Android devices were activated, and 1.2 billion applications were downloaded. Let’s drill down further into the downloads.
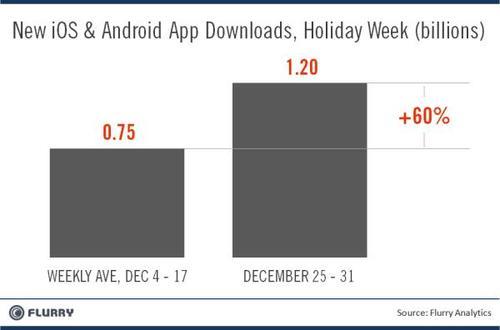
The columns in the chart compare the number of app downloads during Christmas through New Year’s Day (on the right) versus the average of the first two equivalent weeks of December (on the left). The seven days from December 25 – December 31 spanned from a Sunday to a Saturday. As such, we take the average of the first two full Sunday-to-Saturday weeks in December to establish a baseline. The average downloads over these weeks are surprisingly even. For background, the third full Sunday-to-Saturday week, not shown in the chart, December 18 – 24, is elevated slightly due primarily to December 24 downloads. Up until the final week of the year, this penultimate week set the download record with 857 million downloads. The final week of the year, between Christmas and New Year’s Day, grew by 60% over the early-December baseline, historically punching through the billion download barrier for the first time ever to deliver 1.2 billion downloads.
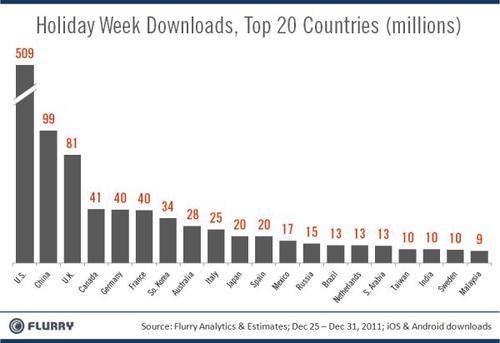
This second chart shows the top twenty countries across which the record 1.2 billion downloads were distributed. Starting from the left, the U.S. took the lion’s share with 509 million downloads, or 42.3%. Referencing an earlier report, wherein Flurry sized the current installed base and market upside for each country, it’s not surprising that the U.S. continues to lead the rest of the world by such a large margin. We estimate that just prior to the holidays, there were 109 million active iOS and Android devices in the U.S. market. Compared to the worldwide total active installed base of 246 million, this was 41%. China, the world’s second largest app market, which has roughly one-third of the U.S. installed base saw only one-fifth of the relative downloads. It’s important to note that the celebration of Christmas as a holiday impacted download performance. While the United States widely celebrates Christmas, China is largely non-religious, with over 60% of the population considering themselves agnostic or atheist. In China, Christians make up just 3 – 4% of the population.
Following the trend that Western countries more widely celebrate Christmas – note the higher positions of countries like the United Kingdom, Canada, Germany, France, Australia, Italy, Spain and Mexico in the chart – these countries over-indexed against largely non-Christian countries of China, South Korea and Japan. For example, South Korea and Japan have the 4th and 5th largest smart device installed bases of all countries, yet they ranked 7th and 10th, respectively, for downloads over the record week. Christmas is not recognized as a national holiday in Japan, and in South Korea, roughly half the population self-identifies as non-religious. As a point of interest, Canada appears to have over-indexed the most, using its 8th largest installed base to drive the 4thmost downloads over the holiday period.
Looking forward to 2012, Flurry expects breaking the one-billion-download-barrier per week will become more common-place. While iOS and Android growth continues to amaze, the market is still by all measures relatively nascent. We look forward to continuing to chart the unprecedented adoption of mobile computing devices, usage of applications and the way in which this technology is changing consumer behavior worldwide. Happy New Year from everyone at Flurry.