In 2007, Apple and Google started a mobile computing revolution. Over the last four years, adoption of this new class of smartphone has been unprecedented. With powerful devices, connected to broadband networks and rich digital stores, an app economy was quickly built on top of it.
Beginning last year, Flurry observed that consumers using apps began expanding beyond early-adopting U.S. and Western European markets, starting to include more emerging economies. In a previous post, we shared details about this shift, highlighting the fastest growing international markets, with emphasis on China’s extraordinary growth.
As 2011 comes to a close, and we look forward to 2012, we size today’s installed base of iOS and Android smart devices (smartphones and tablets) as well as identify markets where the most future upside exists. We start by looking at how many active iOS and Android devices run applications by country.
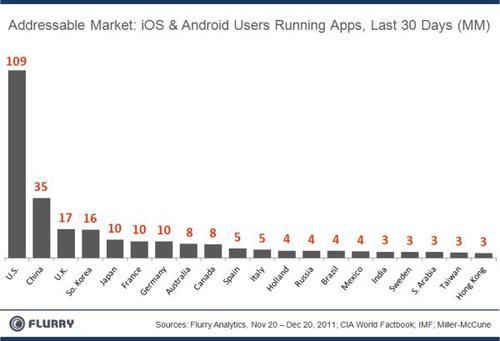
Using data collected from Flurry’s data-set of more than 140,000 apps running on smart devices worldwide, we get a snapshot of how many iOS and Android devices ran apps over the last 30 days. Note that we gross up our figures to reflect differences in penetration per platform to provide market-level estimates. Among the top 20 countries, the U.S. still makes up the largest chunk of the world’s active installed base, with 109 million out of 264 million, or 41%.
Of note, China and South Korea now hold two of the top five positions, boasting addressable audiences greater than that of more developed countries such as Japan, France and Germany. Also worth noting is that our count of 264 million active units in the market is about half of what Apple and Google publicly state have been activated. The difference is primarily due to old device replacement. Flurry is counting recently used devices versus life-to-date device activations.
With smart device adoption skyrocketing worldwide, we next look at which markets hold the most future promise. With greatly varying disposable income per country, and recognizing that children do not purchase devices, Flurry used available data from several sources to adjust its data for an apples-to-apples comparison. First we used the “adult” population counts from the International Monetary Fund (IMF), which IMF defines as 15 to 64 years of age. Next, we adjusted our numbers based on the size of the middle class in each country, primarily using a study by Miller-McCune. We finally estimated the size of the upper class per country, who by extension can also afford a smart device. After making adjustments, we are left with adult consumers who have the financial means to afford a smartphone device per country. Doing so, populous countries like India, China and Brazil, which also suffer from income disparity, are not over-estimated in our addressable market calculations.
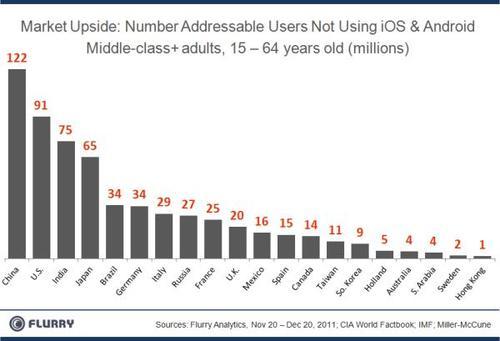
Starting from the left, China has 122 million consumers who do not yet use an iPhone or Android device, but could afford one. In short, this chart represents untapped potential. Emerging economies – China, India and Brazil – make up three of the top five market opportunities. Over the next several years, as these countries continue to modernize, they will significantly expand the worldwide addressable audience for smartphones.
Bringing the data together, we next look at market maturity, which is the measure of how penetrated smartphone devices are among a country’s addressable audience. To illustrate which markets are most mature, we chart the top 10 countries ranked by penetration.
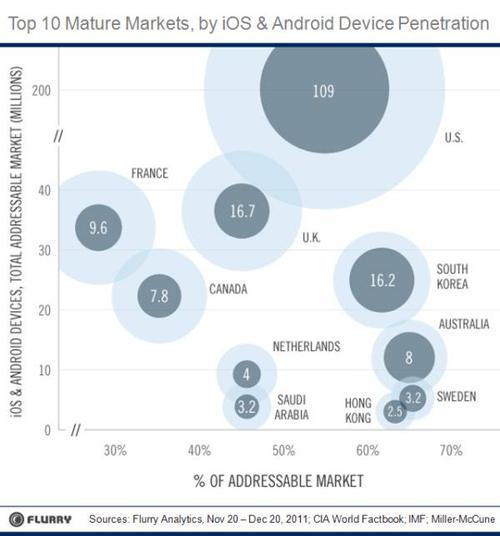
The vertical axis measures our total addressable audience (TAM), which we define as adults, 15 – 64, who are at least middle-class. The TAM per country is represented by the larger, light blue circles. The U.S., with the largest light blue circle, has the largest TAM at 200 million. The horizontal axis shows percent penetration, which is the active user (iOS or Android device that used an app over the last 30 days) divided by the TAM. For example, Sweden is the most mature country with 3.2 million of 5 million (66%) addressable consumers already using iOS and Android devices. France, which ranks 10th in maturity, has 9.6 million of 34 million (28%) consumers using iOS and Android devices. So, from left to right, penetration increases. And from bottom to top, TAM increases. The U.S. leads the world in installed base because its large, addressable audience has been well penetrated, 91 million of 200 million (55%).
Completing our study, we look at the world’s largest addressable markets, regardless of penetration.
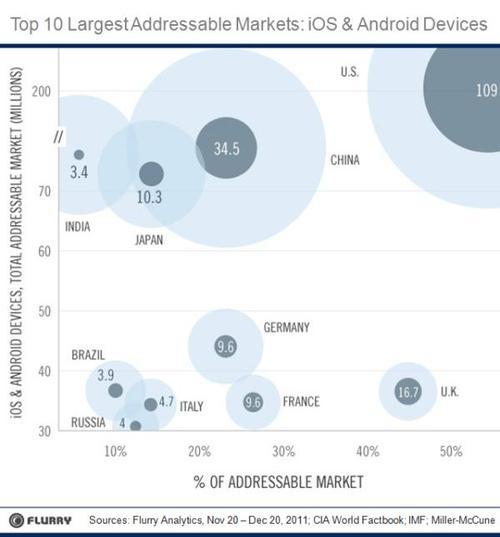
Because this chart measures future potential, TAMs are much larger relative to active user bases. The result, visually, is a lot more “light blue.” Many of the world’s largest countries have largely un-penetrated markets, primarily due to standards of living (emerging markets) or increased competition for consumers’ disposable income (developed markets). In either case, the TAM is there, but the adoption hasn’t yet occurred. So, many of these markets are future bets with the time of maturity somewhat variable and unknown. In this chart, the U.S. has both the largest current installed base and market upside. Again, this is because of its unique, well-penetrated and large, affluent population. Next China, given its very large population (1.3 billion), along with a growing middle class who has already begun adopting smart devices, has the world’s second largest market potential. In comparison, even though India has the world’s second largest population (1.2 billion), its TAM is much smaller than China’s because of India’s very low standard of living. The result is that, even though its total population is not far behind China’s, its total addressable market is. Further, the adoption of smartphones and tablets among its TAM has been small. Finally, Japan, the world’s fourth largest market, has a lot of upside given light penetration of iOS and Anroid devices against its large, addressable market.
iOS and Android sales boomed in 2011, with international smartphone and tablet adoption accelerating. As we look forward to 2012 and beyond, we expect the trend of international expansion to continue. With the world’s estimated middle class now totaling 1.8 billion, there remains a lot of unconquered territory for Apple and Google, who currently lead the charge in driving smart device adoption. This is equally good news for developers, who build apps for these platforms, and directly benefit from their installed base growth.