Although the Internet entered the mainstream a mere 15 years ago, life without it today is nearly incomprehensible. And our use of the web has rapidly changed as well. In simple terms, it has evolved from online directories (Yahoo!) to search engines (Google) and now to social media (Facebook). Built on the desktop and notebook PC platform, the web’s popularity is significant.
Today, however, a new platform shift is taking place. In 2011, for the first time, smartphone and tablet shipments exceed those of desktop and notebook shipments (source: Mary Meeker, KPCB, see slide 7). This move means a new generation of consumers expects their smartphones and tablets to come with instant broadband connectively so they, too, can connect to the Internet.
In this report, Flurry compares how daily interactive consumption has changed over the last 12 months between the web (both desktop and mobile web) and mobile native apps. For Internet consumption, we built a model using publicly available data from comScore and Alexa. For mobile application usage, we used Flurry Analytics data, now exceeding 500 million aggregated, anonymous use sessions per day across more than 85,000 applications. We estimate this accounts for approximately one third of all mobile application activity, which we scaled-up accordingly for this analysis.
Our analysis shows that, for the first time ever, daily time spent in mobile apps surpasses desktop and mobile web consumption. This stat is even more remarkable if you consider that it took less than three years for native mobile apps to achieve this level of usage, driven primarily by the popularity of iOS and Android platforms. Let’s take a look at the numbers.
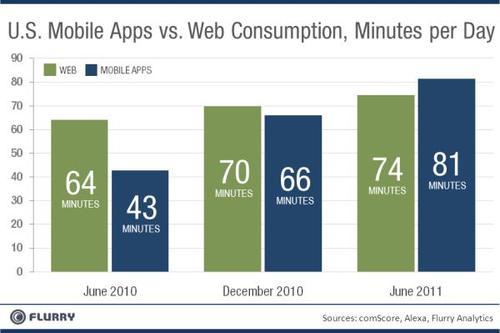
The preceding chart compares the average number of minutes consumers spend per day in mobile native apps vs. the web. For mobile apps, Flurry tracks iOS, Android, BlackBerry, Windows Phone and J2ME. And for the web, our figures include the open web, Facebook and the mobile web.
Flurry found that the average user now spends 9% more time using mobile apps than the Internet. This was not the case just 12 months ago. Last year, the average user spent just under 43 minutes a day using mobile applications versus an average 64 minutes using the Internet. Growing at 91% over the last year, users now spend over 81 minutes on mobile applications per day. This growth has come primarily from more sessions per user, per day rather than a large growth in average session lengths. Time spent on the Internet has grown at a much slower rate, 16% over the last year, with users now spending 74 minutes on the Internet a day.
As a note of interest, Facebook has increasingly taken its share of time spent on the Internet, now making up 14 of the 74 minutes spent per day by consumers, or about one sixth of all Internet minutes. Considering Facebook’s recent leak regarding Project Spartan, an effort to run apps within its service on top of the mobile Safari browser, thus disintermediating Apple, it appears Facebook seeks to counter both Apple and Google’s increasing control over consumers as mobile app usage proliferates.
Games & Social Networking Dominate Mobile App Usage
With mobile app usage soaring, Flurry additionally studied which categories most occupy consumers’ time. For this snapshot, Flurry captured time spent per category from May 2011 across all apps it tracks, now totaling more than 85,000. The results are shown in the pie chart below.
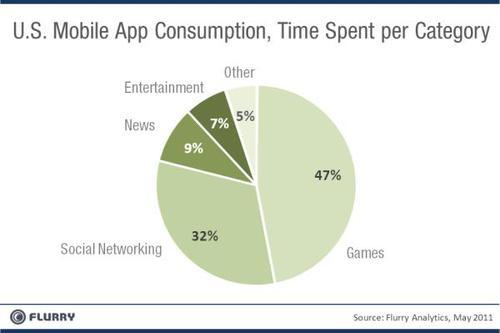
The chart clearly shows that Games and Social Networking categories capture the significant majority of consumers’ time. Consumers spend nearly half their time using Games, and a third in Social Networking apps. Combined, these two categories control a whopping 79% of consumers’ total app time. Further, as we drill down into the data, consumers use these two categories more frequently, and for longer average session lengths, compared to other categories. Any way we slice it, Games and Social Networking apps deliver the most engaging experience on mobile today.
With a better understanding of how consumers spend their time across app categories, Facebook’s Project Spartan makes even more sense. As a category, social networking – which is Facebook’s core competency – commands the second largest allocation of consumers’ time. Games, which typify the most popular kind of app played on the Facebook platform itself, are also the top categories on both Android and iOS platforms. As interactive media usage continues to shift from the web to mobile apps, one thing is certain: Facebook, Apple and Google will all expend significant resources to ensure that no one company dominates owning the direct relationship with the consumer.