While smartphones have reached critical mass, tablets are poised to do the same soon. As a form factor, tablets simultaneously take a step toward the living room and the workplace. For consumers, these devices are multimedia machines, offering a glimpse into how consumers might one day accept connected television. For workers, IT departments are already reacting to the “Bring Your Own Device” wave changing the modern workforce. According to Forrester, 12% of workers already use a tablet at work.
The stakes are high. According to its latest earnings call, more than one out of every three Apple smart devices sold during the last quarter was a tablet, 14 million iPads versus about 27 million iPhones. And with the announcement of the lower-priced iPad mini, more directly competing with Amazon’s Kindle Fire HD, Google’s Nexus 7 and Samsung’s Galaxy Tab 2, we anticipate this ratio to increase more toward tablets during the holiday season.
This report focuses on how consumer demographics and behavior vary between smartphones and tablets. Taking a snapshot in September 2012 from Flurry Analytics, that totaled more than 6 billion application sessions across approximately 500 million smart devices, Flurry provides a comprehensive comparison between smartphones and tablets, spanning age, gender, time of day usage, category usage and engagement metrics. For age and gender comparisons, Flurry leverages a panel of more than 30 million consumers who have opted-in to share demographic data.
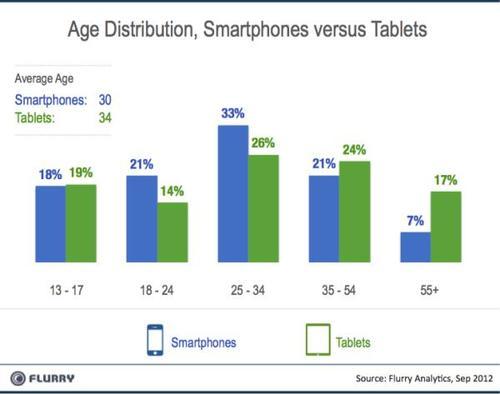
The chart above shows the distribution of age for smartphone versus tablet users across traditional age groupings (aka “age breaks”). The blue bars represent smartphone consumers and greens bars represent tablet consumers. Each group of same-colored bars totals 100%. On average, smartphone users are younger than tablet users, 30 versus 34 years of age. Nearly three quarters of smartphone users are 34 years of age or younger, while more than two thirds of tablet user are 25 years or older. Additionally, recent research from the OPA conducted by Frank N. Magid and Associates indicates that household incomes for tablet owners are becoming increasingly affluent, with 59% of household incomes for tablet owners surpassing $50,000 versus the U.S. average of 41% households with incomes over $50,000.
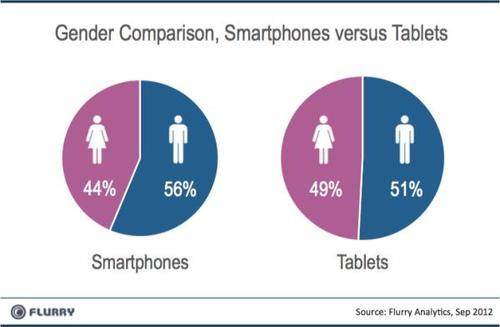
The pie charts above compare the gender split between smartphone and tablet users, with women shown in dark pink and men shown in blue. While smartphone usage trends slightly more male, tablet usage is nearly even. Traditionally, males adopt technology devices more than women. With an even gender split for tablets, this bucks the trend, indicating that tablets likely have more long-term mass-market appeal.
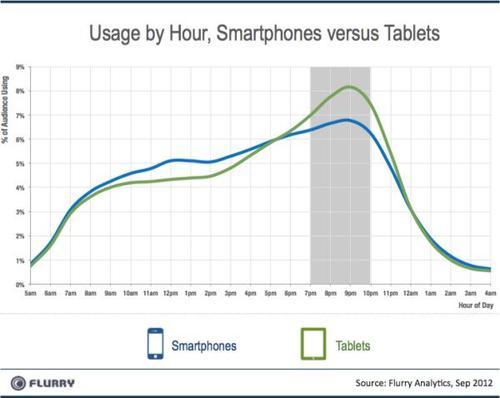
The chart above shows how consumers allocate their time using apps across a day, also called “dayparting.” Smartphone app usage is indicated with the blue line, and tablet app usage with the green line. Each line spans 24 hours of a day and totals 100% usage across the day. Studying the chart, tablets have a greater spike of usage during the prime-time television window, from 7 pm to 10 pm, whereas smartphone usage is more evenly distributed throughout the day. This would indicate that tablets are more often used alongside, or instead of television viewing than smartphones. In an earlier study, Flurry compared the combined usage of tablet and smartphone apps versus the Internet and television.
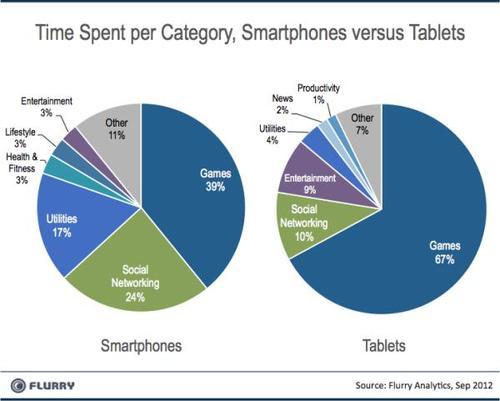
The chart above compares the time spent across app categories between smartphones and tablets. At a high level, consumers spend more time using tablets for media and entertainment, including Games (67%), Entertainment (9%) and News (2%) categories which account for nearly four-fifths of consumption on tablets. Smartphones claim a higher proportion of communication and task-oriented activities with Social Networking (24%), Utilities (17%), Health & Fitness (3%) and Lifestyle (3%) commanding nearly half of all usage on smartphones. Games are the most popular category on both form factors with 67% of time spent using games on tablets and 39% of time spent using games on smartphones. Further reinforcing that tablets are “media machines” is the fact that consumers spend 71% more of their time using games on tablets than they spend doing so on smartphones.
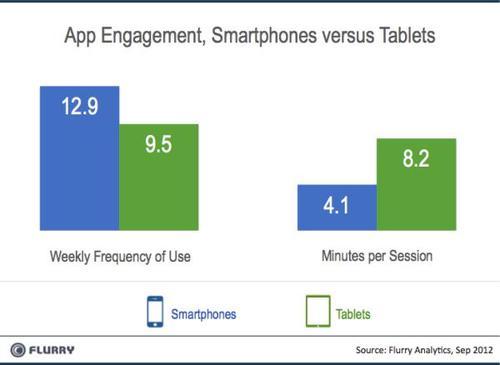
Finally, we compare engagement metrics between smartphones and tablets. On average, consumers use apps on smartphones more frequently but for shorter periods of time. With consumers using tablets more for media consumption, and during the evenings, this stands to reason. Conversely, consumers use their smartphones for shorter periods of time across more sessions over the course of a day to complete tasks like checking into social networks and using utility apps.
Studying smartphone versus tablet usage differences not only provides insight into how developers should consider form factor when designing app experiences, but also how digital distribution could disrupt the living room. As we imagine a world of connected TVs, tablet usage gives us the best current-day hint of that world to come. Tablet users are older, more female, and we can surmise, more affluent. Additionally, they use more during the evenings and for longer sessions. Finally they consume more media and entertainment experiences, with a significant proportion spent on games. In particular, this would indicate that as Apple and Google enter the living room with connected TV initiatives, game consoles made by Sony, Microsoft and Nintendo would experience the greatest competition. The distribution of content into the living room may also significantly change for network and cable television content providers. In summary, the impact of smart devices on both work and play are profound. With a bevy of significant companies vying for tablet hegemony, including Apple, Google, Amazon, Microsoft and Samsung, developers and consumers should expect nothing short of tremendous innovation.
Please note that in previous studies, Flurry combined all smartphone and tablet usage to generate total time spent by the average “smart device” user in a given day. Using the stats provided in this study, a clever reader could back into a comparison to that study. However, breaking out time spent per day using the metrics included in this study (by taking ‘number of sessions per week’ multiplied by ‘time per session’ then dividing by seven days to get to a daily figure) will not simply add up to the total ‘time spent per day’ provided in previous studies. This is because individual users of smartphones and tablets spread their total usage time across multiple devices. By separating out smartphone and tablet usage for this study, the overlap of users who have more than one device is not taken into account. In short, these two studies do not provide an apples-to-apples comparison.