Just five years ago, PCs reigned supreme and so did the US software industry. In 2008, U.S. companies produced an estimated 65% of all PC software units sold on a worldwide basis.
In only half a decade, smartphones, tablets, and perhaps most importantly, apps, have changed the nature of the software industry. In this post we look at where apps are being developed and used and discuss the implications of that for the Post-PC Era software industry.
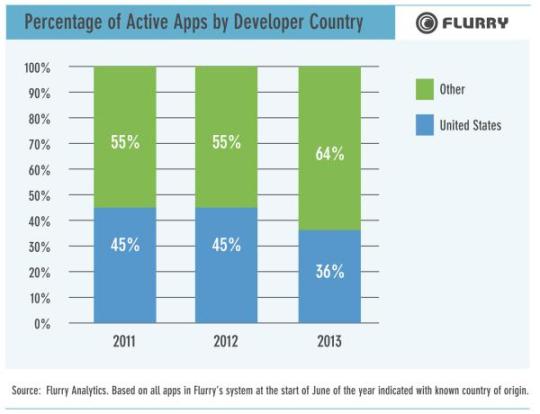
Let’s start by considering where apps are being produced. The chart below shows the percentage of the apps that were recording data through Flurry Analytics as of the start of June in a given year broken down by whether they were created in the US or in another country. As shown in that chart, even in 2011, only a minority of apps were created in the US. By June of this year only 36% of the apps we measure were made in the U.S.A.
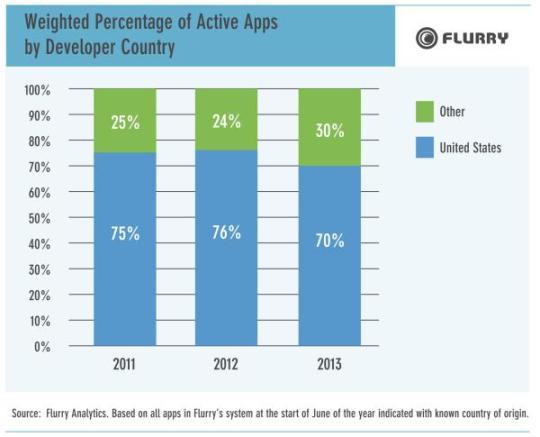
Of course, some apps enjoy much greater use than others, so we next considered how the picture changes if apps are weighted by total time, which takes into account both user numbers and engagement. Once time is taken into account, things look considerably better for the U.S., suggesting that, on average, user numbers or engagement are greater for apps made in the U.S. than for apps created elsewhere. That makes sense given the size of the U.S. population, the fact that it was an app pioneer country, and the number of English speakers in other countries who might be able to use U.S.-made apps without any localization. Nonetheless, even the weighted percentage of apps made in the U.S.A. has dropped in the past year.
This should not lull U.S. app developers into a false sense of security however. That becomes evident from examining where the apps used by people in particular countries are made. That’s what the chart below does, starting with the United States. Nearly sixty percent (59%) of the time U.S. users spend in apps is spent in apps developed domestically, meaning that more than 40% of the app time of U.S. consumers is already spent in apps developed in other countries.
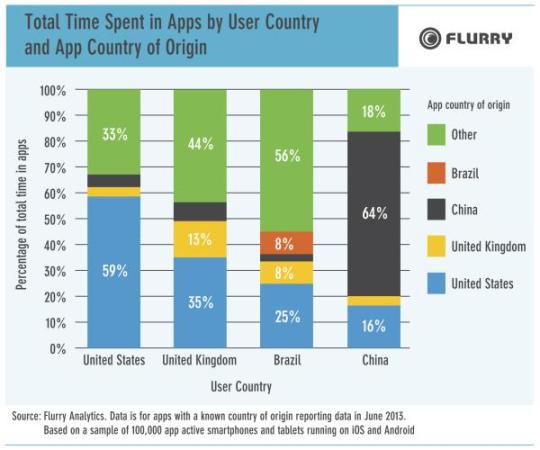
And while U.S. made apps are used elsewhere, unsurprisingly, people in many other countries spend a significant amount of their app time in apps developed in their home countries. For example, 13% of the time spent in apps in the UK is spent in apps made in the UK and 8% of the time spent in apps in Brazil is spent in apps made in Brazil. But as is so often the case, it’s China where things get really interesting. Nearly two-thirds of the time spent in apps in China is spent in apps made in China. U.S. made apps only account for 16% of total time spent in apps in China. The size and growth rate of the Chinese app market imply that the worldwide share of time spent in apps that are produced in the U.S. can be expected to contract further.
Translating apps and adapting apps to make them culturally appropriate is necessary in a country such as China to get most people to download and use most apps made elsewhere. Until recently, rapid growth in countries that didn’t require that type of effort meant that many developers based in the United States probably didn’t want to bother. With growth in the smartphone, tablet, and app markets in countries such as the U.S. slowing and a lot of remaining room for growth in countries such as China, some developers may now be reconsidering that position. It will be interesting to see if many can successfully adapt their apps for world markets.
While many U.S. app developers are just starting to think about globalizing their apps, it has been a near necessity for developers in some other countries from the beginning. Consider the situation facing a developer in a small country where the local language is not one of the world’s dominant languages. Unless they create an app with global appeal (e.g., a flashlight app), or that can be adapted to local markets relatively easily (e.g., translation of a weather app), they are likely to end up with very few users. That is a problem since the time required to develop an app for a small number of users is no different from that required to develop an app used by a large number of people.
Creating global or localizable apps turns that problem into an opportunity. The chart below suggests that developers in countries such as Finland, Denmark, Bulgaria, and Slovenia are taking advantage of that opportunity. The numbers in the chart reflect the impact of app developers in a given country by taking the total percentage of time users worldwide spend in apps developed in that country and dividing it by the total percentage of apps developed in that country. Note that this is equivalent to taking the 2013 percentages in the second set of charts in this post and dividing them by the 2013 percentages in the first set of charts. For example, 70%/36% = an impact of 1.9 for the US. A metric of one or greater indicates that, on average, apps developed in a given country command a disproportionate share of time. The bigger the number, the greater the impact of apps developed in that country.
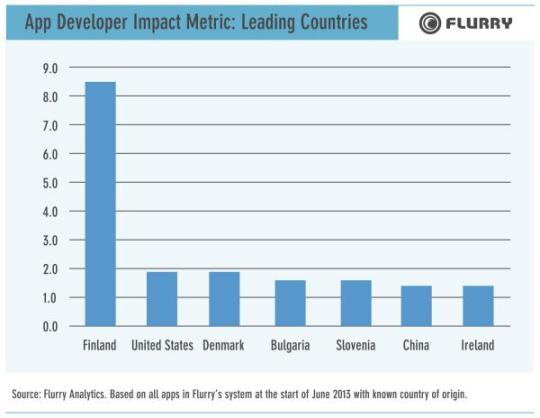
Given the dominance of English, the tendency of U.S. cultural products to spread internationally, and the fact that much of the app economy developed in the U.S., it’s not surprising that the metric for the U.S. is greater than one. China’s large population and the difficulties developers outside of China face developing for that market also make its high impact somewhat expected. What’s much more interesting is that the other five countries that have an impact metric of one or greater are all small, and four of the five speak relatively rare languages.
This, and the low cost of app development imply that the app part of the software industry has the potential to become truly global. For example, as of June of this year, developers in twenty-three countries contributed at least 1000 apps to the more than 350,000 apps Flurry measures worldwide.
There are already examples of worldwide app hits that were developed outside the United States. For example, Angry Birds was developed by Finland based Rovio and has become a worldwide success with hundreds of millions of downloads. The same applies to Cut the Rope, which was developed by Russia-based Zepto Labs and Fruit Ninja which was developed by Australia-based Half Brick Studios.
Three key factors suggest that the markets for apps and app development will become increasingly global.
First, the App Store and Google Play take a lot of friction taken out of software distribution in the app world.
Second, the market is already very large and growing quickly in many parts of the world. In July of 2013, Flurry tracked 1.15 Billion monthly active devices. As our results have shown, there is still some ‘home field advantage’ for local developers, but in theory developers anywhere can create apps for users anywhere.
Third, the cost of development is still relatively inexpensive, especially if you factor in the average salary of software engineers in countries like the Philippines, The Ukraine, and Brazil. The cost of promotion is rising, but total costs are still a fraction of the cost of development, packaging, distribution, and marketing packaged PC software.
In short, geography is becoming increasingly irrelevant in the Post-PC Era.