Freemium games on iOS and Android continue to dominate the app economy, now accounting for over 65% of all revenue generated among the Top 100 grossing apps in the App Store alone. In a series of recent pieces on free-to-play mobile games, we’ve shared insights about the relevance of this business model, consumer spending by price point and what kinds of items consumers purchase.
In this report, we focus on the audience who plays these games. Specifically, we study differences between those who play and those who spend money in mobile freemium games. This study uses data from a sample of iOS and Android freemium games with over 20 million users across more than 1.4 billion sessions gathered from Flurry Analytics, which tracks over 110,000 apps across the major smartphone platforms. Let’s take a look at the results.
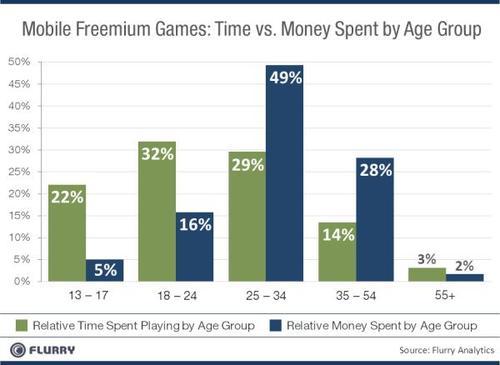
In the chart, we compare the relative distributions of time and money spent by age group. Starting on the left-hand-side, the green bars represent which age groups spend the most time playing freemium games. We see that ages 18 – 24 account for the most minutes spent, 32%, followed by ages 25 – 34 who represent 29% of usage. Ages 13 – 17, 35 – 54 and 55+ then account for the rest of usage time at 22%, 14% and 3%, respectively. The average age of the consumer, based on time spent, is 26.6 years old.
Next to the green bars, in blue, we show the amount of money these same consumers spend on in-app-purchases within the same set of games. The top spending group is 25 – 34 years old, accounting for 49% of total dollars spent, next followed by 35 – 54 year olds at 28%. By contrast, the most dedicated users of these games in terms of time, the 18 – 24 year olds, rank only third in terms of money spent, generating 16% of IAP revenue. 13 – 17 year olds, a popular target audience of these games, account for only 5% of revenue. Finally, the 55+ age group delivers 2% of revenue. The average age of consumers who spend money in these games is 32.2 years old.
Broadly, we observe that heavy users of freemium games are younger, while spenders in freemium games are older. The half that uses these games most, 13 – 24 year olds (55% of time spent), deliver only 21% of the revenue. And the half that spends heavily, 25 – 34 year olds (49% of money spent), represent just 29% of usage. We believe much of this has to do with play patterns, disposable income and relative available time.
In social games, consumers can advance in the game through “the grind,” the core set of gameplay activities that allows the user to level up, earn in-game currency and progress. But to progress via “the grind” takes time and patience. For consumers that have more time (or less money), they can afford (or must be) more patient. Younger gamers, presumably high school and college-aged, likely have more time but less money. So the grind is something they’re willing or must commit to, in order to progress. And with more total available time throughout their days, they can play more frequently. Simply put, they become your loyal users, but it’s harder to extract money from them.
On the other hand, 24 – 35 year olds presumably have more disposal income, but less time, due to work and family demands. This combination makes them less tolerant to engaging in “the grind,” but also better positioned to buy their way out of it. They play less often, but make quicker progress by simply spending. Further, when we expand the age range to 24 – 54, this older group generates nearly four-fifths of all revenue in freemium games. In short, your whales may be older than you think.
Our conclusion: Gen Y plays, but Gen X pays.