Digital distribution of games is disrupting the retail portable game category. At the heart of this disruption is the proliferation of iOS and Android devices, which is doubling as a powerful portable gaming platform and challenging Nintendo DS and Sony PSP for gamer mindshare. In previous reports (2008 - 2009, 2009 - 2010), Flurry measured that iOS’s and Android’s revenue share of the U.S. portable game software category exploded to 34% in 2010 from just 1% in 2008.
Over this same time period, we calculated that Nintendo’s U.S. portable game revenue share contracted to 57% from 75%. All the while, Nintendo chief executive, Satoru Iwata, has remained outspoken, calling smartphone games worthless and warning the gaming industry of boring consumers. In contrast, Wedbush Morgan Securities veteran video game analyst, Michael Pachter, stated in April 2011 that “Nintendo will have to share the market with Apple and Android” because “the onslaught of $1 games is going to continue.” By Flurry’s calculations, the onslaught is now coming in at a crushing $14 per transaction and from within the Trojan horse of freemium (a.k.a. free-to-play) games.
Here we dissect transaction sizes within iOS and Android freemium games, the current juggernaut of smartphone game business models. This report builds on analysis released earlier this month, when Flurry revealed that games drive 75% of revenue generated among the top 100 grossing iOS apps, of which 65% were generated from freemium games. In the chart below, we look at how 3.5 million consumers spent their money across top iOS and Android freemium games.
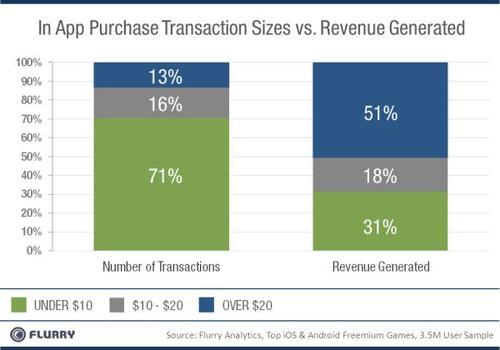
The left-hand column shows the distribution of transaction sizes within freemium games: in other words, how many times consumers spent anywhere from $0.99 to sometimes over $100 per transaction. Each purchase equates to a virtual good or currency in the game a consumer is playing. We organize the data into three price buckets: under $10; from $10 - $20; and over $20. You’ll see 71% of all transactions are for amounts under $10, 16% are for spends between $10 to $20 and 13% are for amounts greater than $20. The average amount spent per transaction is $14.
Let’s spend a moment on the $14 average, which may seem high to you at first blush. There are two reasons the average settles here. First, within the “under $10” bucket, most transactions cluster at the $9.99 level, followed by $4.99, and finally $0.99. In fact, in total, consumers spent $0.99 less than 2% of the time. Why then would so few consumers spend just $1 in freemium games when this price point is so popular among premium games (the pay-before-you-can-play model)? Because freemium games drive a different decision-making mindset for consumers. They simply are deciding whether or not to spend. Our data shows that around 3% of consumers will spend money in freemium games. A deep commitment to the game experience appears to influence their buying habits. The second reason the $14 average seems high is because the high-end of the spending spectrum is very high. Among all purchase price points, over 5% of all purchases are for amounts greater than $50, which rivals the amount paid at retail for top console and PC games.
Now, let’s look at the amount of total revenue generated per price bucket. Scanning this column, we see the amount of revenue generated per price bucket is flipped in comparison to the price points at which the bulk of transactions occur. On the low end, we’re “packing sardines;” that is, accumulating a lot of small transactions. While the under $10 bucket delivers about two-thirds of the transactions, it only accounts for about one third of the dollars. On the other end of the spectrum, at the “over $20” spend-level, we find the “whales.” In fact, further breaking down the “over $20” category, 30% of the total revenue is generated from transaction sizes of over $50. If you’re a game designer, your main take away is that very few transactions—and consumers who complete those transactions—make up the bulk of your revenue. Therefore, your “meta-game” should be about whale hunting.
By the end of 2011, Flurry estimates that total U.S. iOS and Android game revenue will surpass $1 billion. Digital distribution has already affected notable Media & Entertainment industries including film, newspaper, television, music and books. The video game industry is no exception, with portable gaming already feeling the impact. The key to any business playing in this space, whether incumbent or challenger, will be to understand and command consumer engagement, and turn that engagement into revenue events. The freemium business model on mobile, enabled by a device that is always with consumers, and always connected, is unlocking profound new ways to deliver value and extract revenue from consumers, and for far more than just $1 at a time.