December 17, 2014 | Simon Khalaf
It has been just over four years since Apple was awarded a trademark for “There’s an App for That.” Since then, mobile apps have multiplied at an accelerated pace and have even surpassed the web and TV in total time spent. Lately, however, many industry analysts cautioned that in mature markets such as the US and South Korea the rate of app downloads is decelerating and the app market is reaching a saturation point. For example, in August of this year, CNNMoney ran a segment on app overload and the slowdown of app downloads. This fall, Paul Adams of Intercom, wrote a thoughtful and provocative post on the future of apps, predicting that apps will become more of a service layer, replaced by enhanced notifications as the consumer interface. At Flurry, we were curious to see whether our Analytics data validated these theories, so we took a look. We found that consumers are still downloading apps at very nearly the same rate since 2011.
Deceleration? What Deceleration?
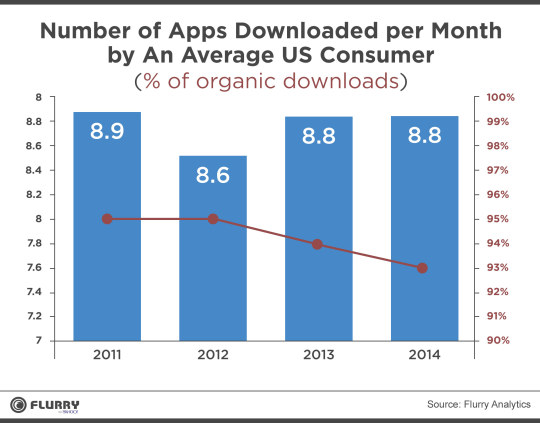
For our research, we focused on the US, one of the most mature app markets. We found that in the US, consumers are downloading apps at the same rate over the past four years. The chart below shows the number of apps an average US consumer downloads per month from 2011 till now. On average, US consumers are downloading 8.8 apps per month in 2014, compared to 8.8 apps in 2013, 8.6 apps in 2012 and 8.9 apps in 2011. This is both iOS apps downloaded from the Apple AppStore and Android Apps downloaded from Google Play or any other Android App store operating in the US. That is a lot of apps downloaded by a single consumer.
This means that there is actually very little change in the rate of downloads since 2011. It doesn’t mean that consumers are continuously using all the apps they’ve downloaded over the years. In fact, they are not. You can look at previous research we’ve published where we shared the half life of apps and their rate of decay.
In our research, we also looked at the percentage of apps downloaded as a result of app marketing (or app install ads) by dividing the estimated yearly app install ads market in the US by the average Cost Per Install (CPI) in the same year. Despite the fascinating growth of app install ads, the vast majority of app downloads are still organic. In fact in 2014, 93% of all app downloads in the US were organic, compared to 95% in 2011. The only thing on a slight decline here is organic downloads. This is a very small change and a further validation of the growth opportunities in app marketing in general and app install ads in particular.
“Install Addicts” Are Keeping up the Pace
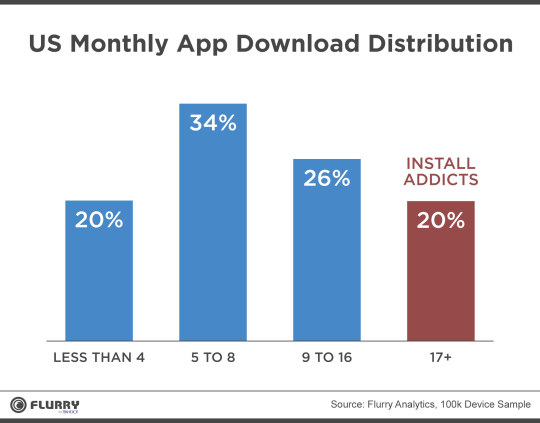
We dug a little deeper into our data to gain better insight into the US consumers responsible for these steady download numbers. The distribution is shown in the chart below. The majority of consumers (54%) are actually downloading less than eight apps per month. What is keeping the average up is a new segment of mobile consumers that we are calling “Install Addicts.” These are US consumers that download more than 17 apps a month. This includes apps downloaded on all smart devices such consumer owns. This segment represents 20% of the US mobile consumer base or an estimated 32 million people.
The Profile of “Install Addicts”
We were intrigued by the large number of Install Addicts, so we dug a little deeper in our data to better understand the audience behind these 32 million US consumers.
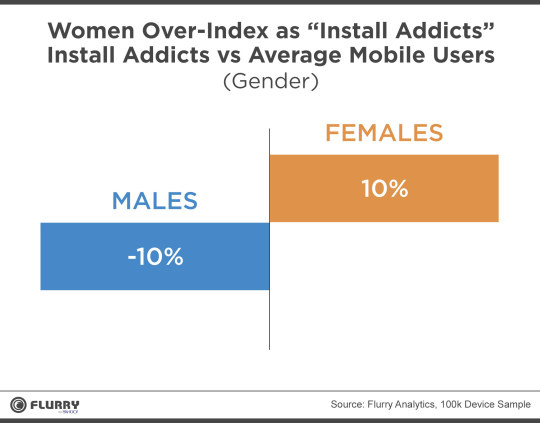
First we looked at gender. Install Addicts are 53% female and 47% male, compared to 48% female and 52% male for the average mobile consumer. That means that females over-index by 10% compared to the average mobile consumer.
We then looked at age groups. Install Addicts over-indexed in the 13-17 (Teens), 18-24 (College Students) and 35-54 (Middle Aged) age groups and under indexed in the 25-34 (Adults) and 55+ (Seniors) age groups.

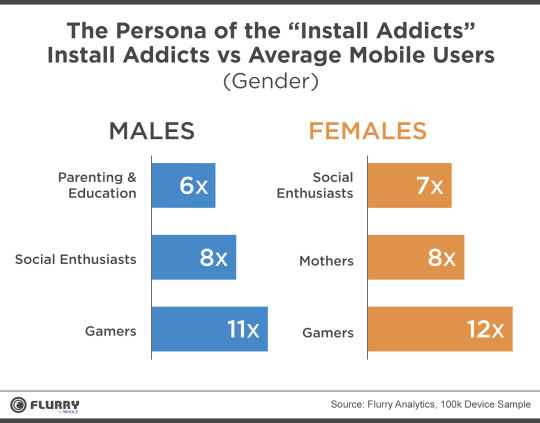
The analysis gets a lot more interesting when we looked at the differences in Flurry Personas. On the female side, the following Personas over-indexed as Install Addicts: Gamers, Mothers and Social Enthusiasts. For males, the following Personas over-indexed as Install Addicts: Gamers, Social Enthusiasts and Parenting and Education.
The “over-index” is shown in the chart below. It refers to the division of the percentage reach of that Persona in the Install Addict segment compared to the percentage reach of that Persona for the average mobile consumer. For example, in the female Install Addicts segment, Mothers are 32% of the total, compared to 4% of the average female mobile consumers. In other words, female Install Addicts are much more likely to be Mothers than non-Addicts.
Looking at the three charts above and comparing this Install Addicts audience to the mobile addict audience we highlighted earlier this year, it is becoming clearer to us that what we call family devices (or shared devices, or hand-me-down devices) make up a good chunk of the Install Addicts audience. Such devices are for the mother or the father, but the children (teens) have access (and most likely passwords) to them and routinely visit the App Stores and download their new favorite app.
It is also hard for us to ignore the over-indexing of the Social Enthusiast persona. This is the Flurry Persona of consumers that heavily use social apps, including messaging apps and photo and video sharing apps. It could be a mere coincidence that Install Addicts are also messaging and social networking addicts, but it could also indicate that consumers are discovering apps through social and messaging applications. In the United States, both Facebook and Twitter have solid app install businesses. In Japan and China, LINE and Tencent, respectively, have bet big on game and app distribution, organic and paid, as lines of business. While it is still hard to measure the true impact of social discovery on app downloads, the chart above seems to indicate a big one.
We are a week away from the height of the holiday season, one that traditionally accelerates app downloads and brings app developers in general and game developers in particular more consumers to their apps. But as the data above suggests and as the past four years have demonstrated, app developers don’t need to wait for Saint Nick. They simply need to keep hoping for app install addiction to keep going strong.