Smartphones and tablets continue to break new consumer technology adoption records. From earlier research, Flurry found that iOS and Android smart devices have experienced twice the uptake rate compared to that of Internet adoption, and four times the rate compared to that of PC adoption. Following this unprecedented adoption, advertising dollars are beginning to flow into mobile. A recent IAB study reported that 63% of top brand marketers have increased their mobile advertising spending over the last two years, and that 72% plan to increase advertising spending over the next two years.
Focused on mobile advertising, this report has two parts. First, Flurry compares the allocation of advertising spending across various media versus the actual time consumers spend across those same media. Next, through detailed demographic breakdowns, we share which audience segments are best responding to mobile advertising. Let’s start by understanding trends in media usage versus ad budget allocation.
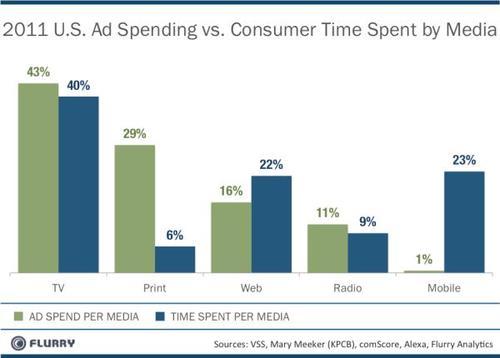
In the above chart, Flurry aggregated publicly available data from VSS and Mary Meeker (KPCB), then layered in its own analysis to reflect the growth in app usage we observe. With our adjustment, we resized the totals for U.S. advertising spending by media and consumer time spent using each media. From left to right, represented by the green columns, is the proportion of advertising spending across each major media. TV and Print command the greatest advertising spends in the U.S. with 43% and 29% of the total, respectively. Web, Radio and Mobile channels round out the balance of media spending with 16%, 11% and 1%, respectively. Adjacent to the ad spending columns is the amount of time consumers spend by media type, represented by blue columns. TV leads consumption with 40%, followed by Mobile and the Web with 23% and 22%, respectively. Radio and Print complete the picture with 9% and 6% of usage, respectively.
Comparing where usage and spending vary most, one notes severe over-spending in print advertising and even more severe under-spending in mobile. Web usage also shows sizable under-investment, relative to platform usage, though not as dramatically as seen on mobile. In short, despite the fact that mobile advertising is growing, the platform is far from getting rational levels of spending compared to other media.
We believe the main reason for this disparity is that the mobile app platform has emerged so rapidly over such a short period of time. With the iOS and Android app economy only three-and-half years old, Madison Avenue and brands have yet to adjust to an unprecedented adoption of apps by consumers. Further, the mobile advertising ecosystem remains nascent, without sophisticated platform tools. Concepts of audience measurement and segmentation on mobile are still forming, and mobile lacks the kinds of systems that agencies take for granted on the web. For instance, mobile inventory is difficult to buy in volume, ad networks have yet to be integrated into Demand-Side Platforms (DSPs) and common standards for ad serving, tracking and settlement are yet to be defined. Just consider that large publisher properties like Facebook have yet to monetize their mobile properties, with many still needing to hire media sales organizations to position themselves to do so. As the mobile platform matures, and these problems are addressed, mobile advertising is poised to take off in earnest.
For the second part of our analysis, we measure which audience segments respond best to mobile advertising, leveraging data from our own ad network, AppCircle, as well as publicly available data. Taking a sample of 60,000 daily active users on iOS, from among a total group of 6 million for whom we have demographic data, we calculated the effective cost per mille (“thousand” in Latin), or eCPM, earned by publishers. Using eCPM allows us to consider both branding (e.g., CPM) and performance (e.g., CPC and CPA) advertising campaigns in our calculations to get an accurate read on which mobile audiences monetize best. In the following charts, we display eCPMs by age and gender, household income and educational level attained. The higher the eCPM earned by audience attribute, the more valuable the audience is to both advertisers, who pay top dollar to reach this audience, and publishers, who earn the most revenue for selling access to this audience. Let’s start with audience breakdown by age and gender.
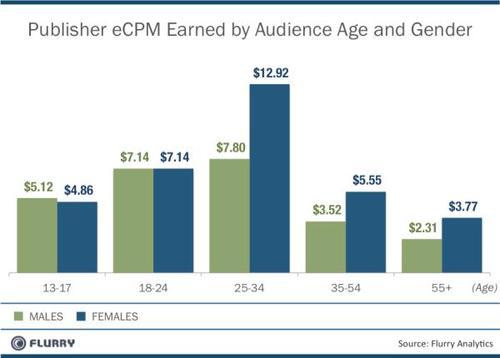
The chart above shows the value of mobile application segments by age and gender. Males are shown in green and females are shown in blue. The value above each respective column is the eCPM earned by that segment. For example, 25 – 34 year old females fetch the highest eCPMs at around $13, driven by underlying high click-through and conversions rates. In fact, females are the more desirable target audience across most age breaks, tied with men in the 18 – 24 year old age range, and exceeding them at 25 and older.
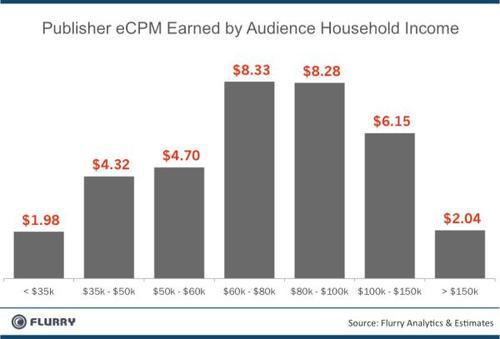
Breaking out eCPMs by household income shows that income ranges from $60,000 to $100,000 are the most valuable, with $100,000 to $150,000 also performing very well. For mobile advertising, there appears a strong correlation between affluence and eCPMs. This squares withearlier analysis from Flurry that found households with iOS and Android smartphones are, on average, 50% more affluent ($44,000 average U.S. household income vs. $66,000 average U.S. smartphone household income). Smart device owners are, on average, more affluent and more educated.
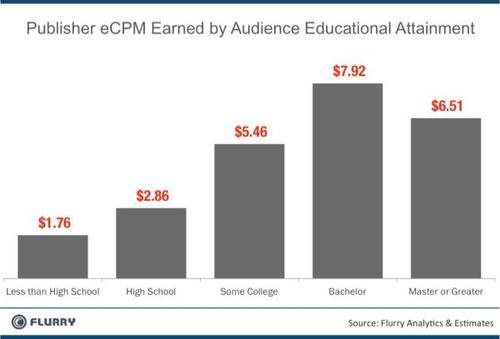
Similar to household income, we find that those who attained higher levels of education are more valuable segments in terms of eCPM generation. Those with a bachelor degree fetch the highest eCPMs, close to $8.00. The second most valuable segment are those even more educated, having earned a master degree or higher.
As a total snapshot, our analysis shows that females and males, between the ages of 25 and 34 years old, who have higher levels of disposable income and a bachelors degree or higher, more strongly interact with mobile ads. Leading sociologists William Thompson and Joseph Hickey define this class as “the rich” or “upper middle class,” comprised of highly educated salaried professionals whose work is largely self-directed. Typical professions for this class include lawyers, physicians, dentists, engineers, accountants, professors, architects, economists and political scientists.
What bodes best for the outlook of mobile advertising is the quality and quantity of the audience that not only uses smartphones and tablets, but also interacts with ads on these devices. Based on our analysis, revealing that the most sought after segments already interact most with mobile ads, a key ingredient required to realize the promise of mobile advertising is the introduction of mobile ad platforms that can segment publisher audiences and enable targeting by advertisers to reach segments of their choice. Like online, which is infinitely more measurable than Print, Radio and TV, mobile advertising is poised to grow radically with the introduction of scalable, data-driven solutions that put advertisers and publishers in control of their own destiny. Actionable data and well-built platforms are the keys to unlocking Madison Avenue spending.