All advertisers seek to deliver the right message to the right person at the right moment. If content is king, then context is queen – particularly when it comes to mobile devices that are typically close at hand if not in our hands.
Smartphones and tablets are often lumped together as “smart”, “mobile”, or “connected” devices, but their use varies by person and by context. In this post, we explore context as it relates to iOS devices. We discuss who uses each device, which devices are used to enact what aspects of users’ lives and personalities, and when usage tends to take place.
Because Android and iOS devices have different audiences, we focus only on iPhone and iPad in this post. Flurry currently measures activity on 397 million active iOS devices, and this analysis is based on usage during May of a random sample of 44,295 of those (iPhone and iPad only; iPod Touch was not included). A future post will discuss usage patterns on Android tablets and smartphones.
Flurry has developed a set of Personas in which device users are assigned to psychographic segments based on their app usage. An individual person may be in more than one Persona because they over-index on a variety of types of apps. Those who own more than one device may not be assigned to the same Personas on all of their devices because their app usage patterns may not be the same across devices.
We started this analysis by considering what share of iOS devices used by members of each persona were iPhone and iPad. As shown in the “everyone” benchmark in the chart below, overall iPhone had a 72% share and iPad had 28%. The Personas shown above the “Everyone” bar skew more toward iPhone than the general population of iOS device owners, while the Personas shown below the “Everyone” bar skew more toward iPad.
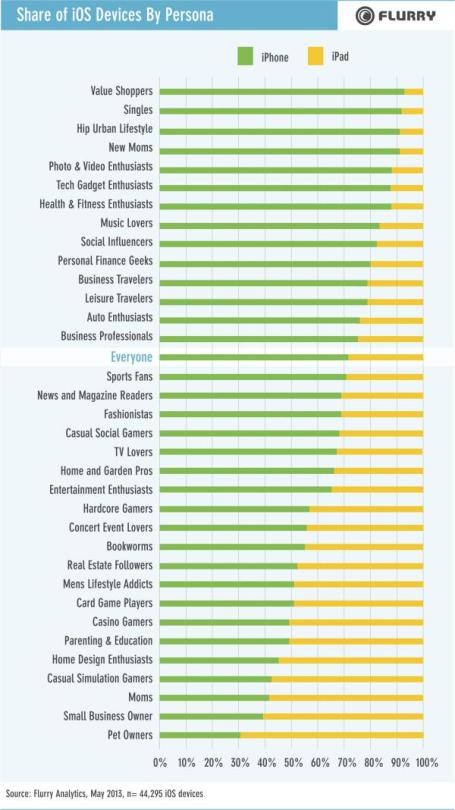
Beginning at the top, the numbers illustrate that Personas “on the move” skew most heavily toward iPhone: Value Shoppers use iPhone to scan barcodes and find bargains, and Singles and Hip Urban Lifestylers use them to socialize. iPhone represents more than 90% of iOS devices (excluding iPod) owned by members of those Personas.
Somewhat surprisingly, that is also true of New Moms. In that case they may still be on the move, but in pursuit of the goods, services, and support they need for their new babies. New Moms may also have less free time to participate in leisure activities like reading and gaming which, as we will show soon, are more heavily associated with iPad.
It appears that moms’ device usage changes as their children get older. Moms (as opposed to New Moms) are one of the Personas that skew most toward iPad. Evidence from other sources and anecdotal observation suggests this is likely to be at least partially attributable to Moms using their tablets to entertain and educate older children. The fact that the Parenting and Education Persona skews toward iPad also supports this.
Moving to the bottom of the chart, the Personas that heavily favor iPad are associated with home-oriented activities. Those include Pet Owners and Home Design Enthusiasts, but also Small Business Owners, who may work from home. Gamers also skew more heavily toward iPad.
The time iPhone and iPad owners spend in different categories of apps also support the overall pattern of iPhone going out and iPad staying in. Overall, iPad owners in our sample spent 42% more time in apps on their devices than iPhone owners during May, but that time varied significantly by category. As shown in the chart below, compared to iPad owners, iPhone owners spent more than 13 times us much time using Navigation apps. They spent more than five times as much time using Health and Fitness apps to do things such as tracking walks, runs, and bike rides.
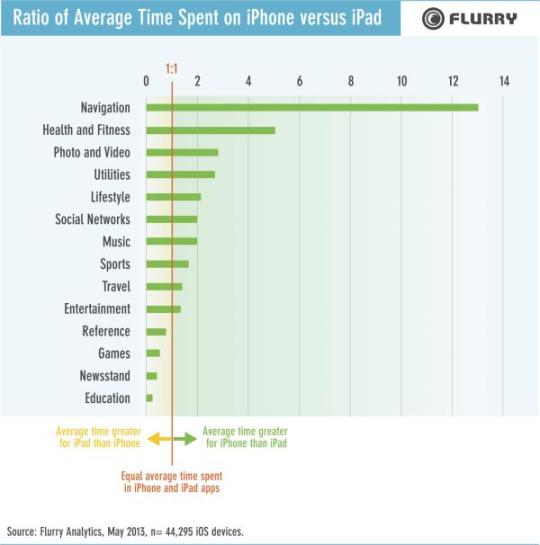
The app categories for which average time spent on iPad exceeds that for iPhone are Education, Newsstand, Games, and Reference. Again, more home-oriented activities.
The chart below shows how time spent using iPhone and iPad apps is distributed throughout the day. As might be expected based on the previous discussion and conventional wisdom about iPad, its heaviest period of use comes between 6 pm and 11 pm – times when most people have downtime for activities such as games and reading. iPhone app usage also peaks during that time, but the absolute amount of time on iPad and the percentage of app use that occurs during those hours is greater. Both of those differences are statistically significant.

The situation reverses as the night wears on, and between 2 am and 4 am usage is greater in iPhone apps than in iPad apps. This may be insomniacs reaching for phones at their bedside or those Singles and Hip Urban Lifestylers finding their way home from a late night.
What is perhaps most surprising about the distribution of time on each device throughout the day is how consistent the patterns are – especially between about 6 am and 4 pm. Given what we’ve described so far about iPhone being more of an out-and-about device and iPad being more of a stay-at-at home device, we believe that this is a function of varied lifestyles, with owners of different devices being at home and out-and-about at different times.
Our discussion up until now has focused on differences between iPad and iPhone owners, but obviously an increasing number of people own both devices. While our data does not enable us to link the same user across his or her different devices, we believe that individuals may express different parts of their personalities and lifestyles through their use of different devices. For example, by night a person in the Single and Hip Urban Lifestyle Personas may use her iPhone to organize her social life. By day that same person may use her iPad to run her interior design business, putting her in our Small Business and Home Design Enthusiast Personas.
That combination of person, usage situation and device is important for app developers and advertisers. For example, in this situation, our single small business owner may be more receptive to work-oriented apps and ads on her iPad and play-oriented apps and ads on her iPhone. Savvy app developers and advertisers will increasingly factor contextual differences such as those into their development and targeting plans.