The press is buzzing that Apple may unveil a phablet-sized iPhone 6 on September 9th. Six years ago, who would have guessed that an extra inch of screen space could cause so much commotion?
Last Spring we reported that, as of February 2013, the phablet was an insignificant player in the mobile ecosystem dominated by phones and tablets. In fact, we said that this new kid on the block was not having a meaningful impact among consumers, developers or manufacturers. Today we are taking a second look to see how far phablets have come since our original report.
For this study Flurry examined a random sample of 59,214 devices worldwide to understand how phablets - like Samsung’s Galaxy Note - have penetrated the mobile market, who is adopting them, and how device size influences usage. For the purpose of this study, and comparison to our past report, we are categorizing devices as follows:
1. Small phones (e.g., most Blackberries), 3.5” or under screens
2. Medium phones (e.g., iPhone), between 3.5” - 4.9” screens
3. Phablets (e.g., Galaxy Note), 5.0” - 6.9” screens
4. Small Tablets (e.g., Kindle Fire), 7.0” - 8.4” screens
5. Full-size tablets (e.g., the iPad), 8.5” or greater screens
Today the story looks different than it did a year prior and it appears that Phablets are beginning to hit their stride. To make things clear, the three charts below compare numbers from January 2014 to the figures we previously reported from February 2013.
Phablets Have Almost Quadrupled Their Share of App Activity in 12 Short Months.
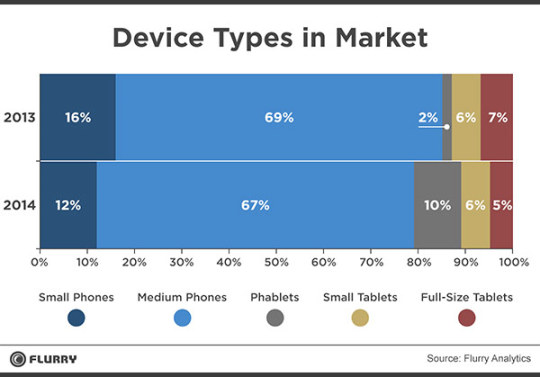
The first chart below shows how the top 500 device models break down by form factor in the market. The data shows that manufacturers have put more Phablet SKUs into the market over the past year, while reducing the number of smartphone and tablet models available (with the exception of Small Tablets). In 2013, a mere 2% of the kinds of devices Flurry saw were Phablets, whereas in 2014, Phablets represent 10% of all device types Flurry tracks across the mobile universe. This proliferation of larger screens comes at the expense of Small and Medium Phones. OEMs have invested in Phablets, presumably in response to (or anticipation of) increased consumer demand for more real estate.
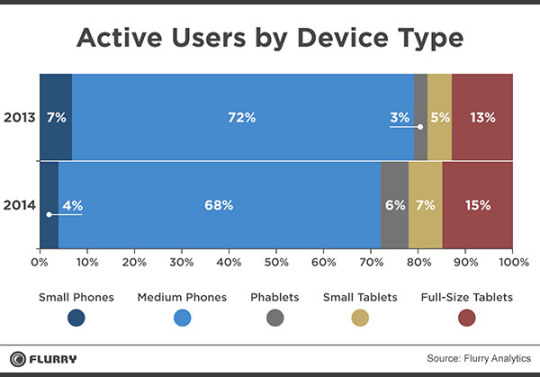
Going a level deeper, we looked at the adoption of all these types of Phablets as measured by Active Users. Over the course of a year, the installed base for Phablets doubled. Today, 6% of all mobile users are on Phablets, compared to 3% a year ago, and again, this growth has come at the expense of Small and Medium Phones. Meanwhile, consumers are continuing to embrace tablets as well. Small Tablets grew from 5% of active users to 7%, and Full-size tablets also grew from 13% to 15%.
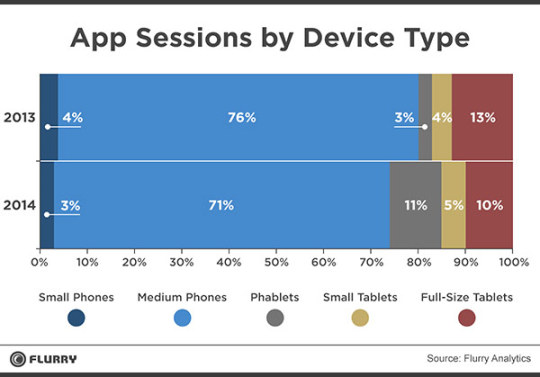
Perhaps the most interesting growth trend and the most exciting shift for developers is in App Sessions, shown below. App sessions are an indicator of actual device usage, and Phablets command a disproportionate share of that app activity. While they account for only 6% of active users, Phablet users account for 11% of all app sessions. This is up from only 3% of sessions in 2013.
Among Android Users, Bigger is Better
iOS currently doesn’t offer a Phablet, so we looked through an Android-only lens to get a clearer idea of how Phablets are faring.
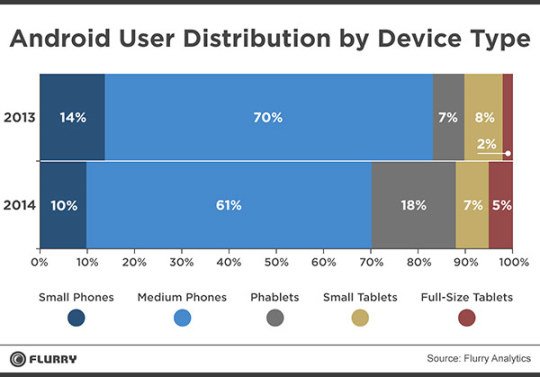
Today, Phablets account for 18% of all active Android devices compared to 7% in 2013, a sign of significant, growing demand for larger phones. Over the same time period, demand shrank 9% for Medium Phones and 4% for Small Phones running Android. Demand for tablets (Small and Full-size) also grew from 10% to 12% over the course of the year. Android users are upgrading to larger devices.
Who are These Phablet Users?
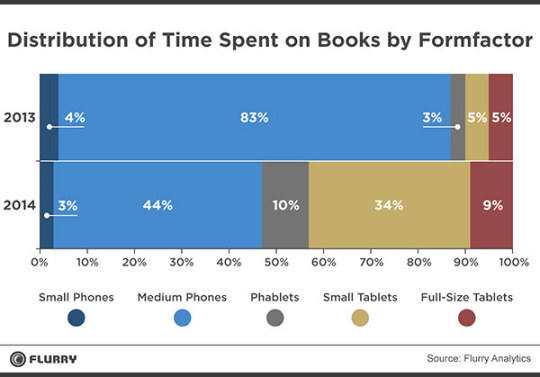
After examining the most popular categories of apps, we can report that there is not one “killer category” that captivates Phablet users. In fact, they behave a lot like consumers on smaller devices, with gaming, social and entertainment as the leading app categories. Interestingly, books is the category in which Phablet users over-index the most. 10% of total time spent in books on all devices comes from Phablets, up from 3% in 2013. Remember, Phablets only account for 6% of the installed base, so the fact that they account for 10% of total time spent in books means Phablet lovers are serious readers.
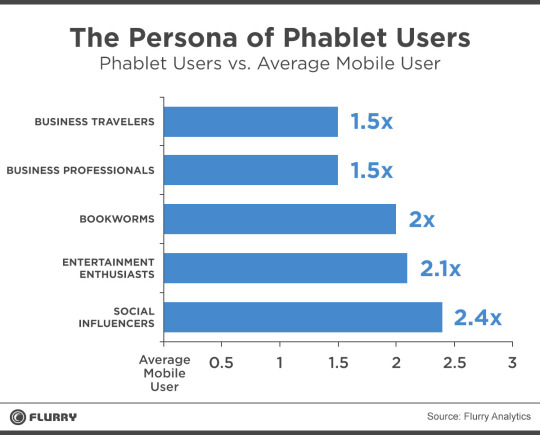
We also used Flurry Personas as a proxy for the behavioral makeup of Phablet lovers. Compared to the average mobile user, Phablet users over-index in the Social Influencer Persona by 2.4x. 35% of Phablet users are social influencers, compared to just 15% of mobile users across all devices, while 12% of Phablet users are entertainment enthusiasts, compared to just 6% of all mobile users. Business Travelers and Business Professionals both over-index in the use of Phablets by 1.5x the average mobile user.
Our data affirms what Samsung and other Android manufacturers have known for some time: Consumers are hungry for bigger screens. For the last six years, smartphones and tablets have been replacing everything from TVs to magazines to PCs to books as the primary way people consume information and media. As mobile screens becomes even more integral to our daily habits, it makes sense that people want more room to roam. We’ll be watching tomorrow to see if Apple agrees.