The Super Bowl is one of the world’s top media events. This year’s contest, Super Bowl XLVII, was hosted in New Orleans and drew an average of 108.4 million viewers, the third largest audience in U.S. television history. According to Nielsen, previous Super Bowls captured the top two U.S. TV audiences, with last year’s event drawing 111.3 million viewers and the previous year’s attracting 110.0 million.
While the contest on the field pitted the San Francisco 49ers against the Baltimore Ravens, an equally fierce battle for consumer engagement was waged across multiple screens. As the world’s top brands paid up to $4 million to air 30 second television spots, consumers were more distracted than ever, accessing mobile apps and social media in droves. Twitter reported 24.1 million Super Bowl-related tweets, the most popular of which focused on Beyoncé, Destiny’s Child, the Superdome power outage and key game moments. Facebook reported similar increases in conversations around these topics.
In this report, Flurry finds that mobile appears to have become the first screen. The implication is that, from this day forward, as marketers advertise on television, they must ensure that the content is sufficiently compelling to pull the consumer away from her smartphone or tablet. While TV may continue to be widely regarded as the first screen, Flurry believes that brands need to reverse that logic in order to reach and engage their consumers.
For this study, Flurry measured U.S. app session starts, per second, over the course of this year’s Super Bowl, last year’s Super Bowl, and the equivalent time period on the Sunday before this year’s Super Bowl (to establish a baseline for an average Sunday) from 3 PM PST to 8 PM PST. Flurry Analytics is used by 275,000 apps, including many of the most-used apps, with aggregate daily usage sessions of 2.4 billion.
For this analysis, we estimated U.S. app session starts occurring on Super Bowl Sunday by sampling from our own data and extrapolating based on the proportion of the market that Flurry “sees.” To be able to compare across last year’s to this year’s Super Bowl, we created an index where “100” represents a baseline for app usage. Let’s start by looking at how this year’s Super Bowl app activity compared to that of last year’s.
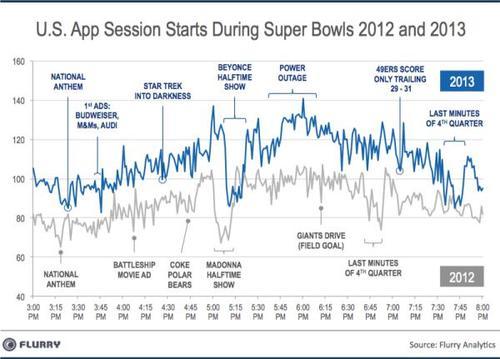
The chart above shows this year’s Super Bowl in blue compared to last year’s Super Bowl in grey. The spark lines show application session starts in the U.S. sampled from Flurry’s system, per second. The way to interpret the chart is that if the line is moving up, consumers are picking up their phones (or tablets). And if the line is moving down, consumers are putting down their phones (or tablets). In other words, when something on the TV cannot sufficiently hold the consumer’s attention, she often reaches for her connected device. The advantage for using mobile app usage as a signal is that we can accurately measure when consumers are interacting with the mobile apps. In this way, we can distinguish between active (consumer is using the “app”) and passive use (app is just “on”). Using mobile app usage as a signal, the events to which consumers paid the most attention were the National Anthems, Halftime shows and close finishes.
A few structural differences to the length, shape and height of the curves are worth noting. First, last year’s Super Bowl was faster up through the first half, as we see that Madonna’s half time show started earlier compared to Beyoncé’s. Additionally, this year’s Super Bowl was further extended due to the 34-minute power outage in the Superdome just after the beginning of the 3rd quarter. Relative to last year’s Super Bowl, consumers began picking up their phones and tablets en masse during this period. Next, this year’s Super Bowl curve (blue) sits higher than last year’s curve (grey), which indicates that there was more relative app usage in the U.S. this year versus last year. Specifically, we measure a 19% increase in app usage between last year’s Super Bowl versus this year’s.
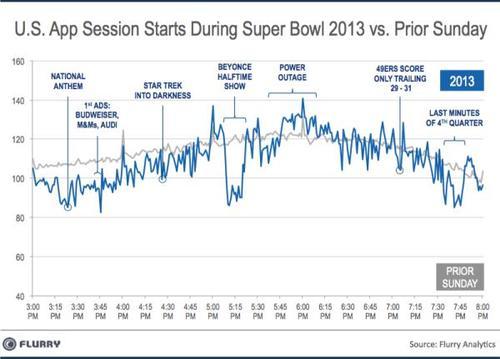
The chart above plots app usage during this year’s Super Bowl against the same time period from the Sunday before. This gives us a sense for how much application usage varies on a normal Sunday compared to Super Bowl Sunday. Overall, total app usage dropped in aggregate by only 5% from the Sunday before to Super Bowl Sunday, which suggests that the Super Bowl largely failed to curb consumer app usage when compared to normal behavior. The height and the shapes of the curves are very similar. More notable differences did appear from just before the Super Bowl started up until about half way into the second quarter of the game, where consumers appeared to be paying more attention to the Super Bowl (i.e., the blue line was modestly below the grey line for that period). We also note a spike in app usage during the Jeep halftime report during the sports analyst commentary, followed by a plummet in activity during Beyoncé’s performance. Next, during the outage, consumers began using their apps. After gameplay resumed, app usage was very similar to a normal Sunday except for the last minutes of this year’s close Super Bowl finish, as the 49ers mounted an exciting, narrowly-missed comeback.
Next we studied how app usage varied during different times during the Super Bowl: while the game was on, when ads were broadcasted, during halftime and during the power outage. We used app activity during the game as a baseline.
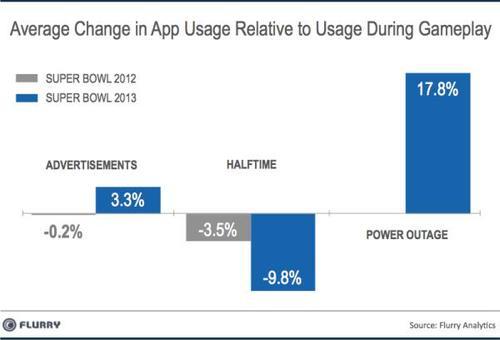
The overall finding was that app usage did not vary greatly between commercials and game play, with only a slight increase in app session starts during ads in this Super Bowl, and an even smaller decline in session starts during the last Super Bowl. In contrast, session starts dropped by nearly ten percent during this year’s halftime. That suggests that while Beyoncé was compelling enough to cause viewers to put down their phones, much of the game and many of the ads were not. The large increase in app session starts during the power outage provides additional evidence that TV cannot hold attention without compelling content. Consumers turned to their smaller screens in great numbers as soon as there was a lull in the action on TV.
Of course, there is variation within these averages. Groups particularly prone to starting app sessions during ads include: Photo & Video Enthusiasts, Real Estate followers, Small Business Owners, TV Lovers and Movie Lovers. For your convenience, you can find Flurry (psychographic) Personas listed here. Consumers less inclined to start app sessions during ads include iPad Users, Food Enthusiasts, Catalog Shoppers, Fashionistas and Home & Garden Enthusiasts. Those most inclined to take a break from their apps and watch the halftime show included Home & Garden Pros, Health & Fitness Enthusiasts, Fashionistas, Catalog Shoppers and Food Enthusiasts. Groups whose app use climbed most during the power outage – suggesting that they were paying closest attention to the game at other times – were Males, Seniors and Sports Fans.
Ratings from Nielsen confirm that people continue to sit in front of TVs on Super Bowl Sunday. However, the fact that overall app usage declined by less than just 5% compared to same time period on the prior Sunday suggests that a large amount of consumers’ attention is spent in apps, even as they sit in front of the TV. This should cause advertisers to question the value of paying a premium for Super Bowl ads when the attention premium they command is eroding. That’s particularly true for some groups. For example, overall app usage by Moms, during the time the Super Bowl was on, dropped by less than two percent compared to the previous week. While Tide’s “Miracle Stain” ad was certainly entertaining, it appears that the “Mom” target market was not paying attention.
The price of a Super Bowl ad pays for a lot on mobile whether that’s in app advertising, sponsored content, in-app product placement or branded apps, and Flurry believes many marketers may benefit from reconsidering their media mixes in light of evidence in this report showing that unless exceptionally interesting things are happening on TV, a significant and increasing amount of consumer attention is spent using smartphones and tablets.
Brands who continue to believe in the potential of TV during major events such as the Super Bowl must also now understand the multi-screening behavior of their target market, and take that into account in developing their campaigns. For example, marketers targeting Fashionistas would be well-served by scheduling ads to run during or near the half-time show, while running in-app ads during the game itself. The reverse strategy would apply to groups such as Sports Enthusiasts. These results also have implications for those who wish to run integrated campaigns across screens: those will only be effective if the TV portion is compelling enough to pull attention away from the screens in the hands of the audience.
With the holy grail of TV events disrupted, advertisers need to take note. The winner of the Screen Bowl is the smartphone. Mobile is here. Mobile is the new first screen.