The data in this report is computed from a sample size of 200 applications, 25 million consumers and four platforms: Apple (iPhone and iPod Touch), Blackberry, JavaME and Google Android.
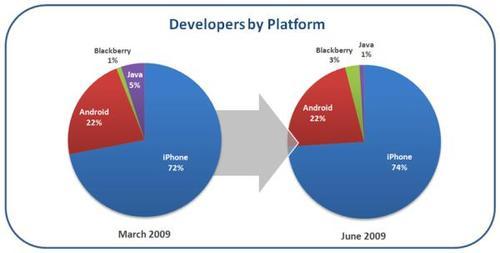
When Flurry released its March 2009 Pulse, we declared iPhone the undisputed winner, leading by a wide margin over Google Android in all key categories: number of developers, applications and consumers. Since then, the number of developers, applications and consumers in Flurry’s network has grown by more than three times. Revisiting market share, we find that Android has maintained its percentage share over this rapid period of growth. While the iPhone still dominates the application market, Google Android has managed to prevent Apple from widening the gap. With 1) reports that roughly 20 more Android handsets will ship during 2009, 2) continued application saturation in the App Store making it harder for developers to compete for consumer downloads and 3) the relative ease required to develop for Android versus iPhone, Google appears well positioned to chip away at iPhone’s dominant position.
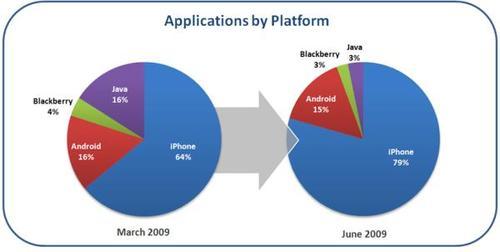
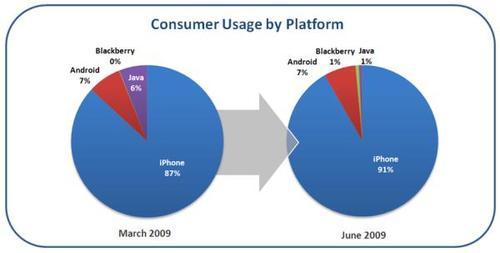
For Blackberry and JavaME, however, our sample shows that Apple continues to cannibalize those platforms.
Comparing a group of applications available on both iPhone and Android, we found that Android consumers use their applications longer. To measure this, we tracked the percent of users who still use an application after downloading it over different periods of time. Across all time periods, Android users continue to use their applications longer. For the longest period of time measured, 90 days, the proportion of Android to iPhone usage was approximately 50% greater. Please see the specific figures in the graph below.
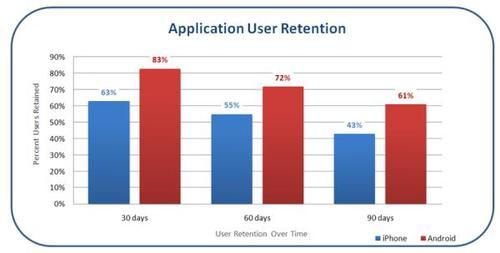
One reason we believe retention rates vary is that Android offers far fewer applications compared to iPhone. With applications coming out on iPhone at a faster rate, iPhone users move onto other apps more quickly. For Android users, they make more use of what’s available, with less temptation to move to the next application. Other factors that could also play a role:
Regardless of the underlying drivers it’s clear that at the current volume of available Android apps, usage is stickier.
Further studying our set of applications with both iPhone and Android versions, Android consumers used their applications significantly more frequently than their iPhone counterparts. 37% of iPhone consumers who downloaded applications used those applications fewer than 5 times per month (“superlight users”) with Android having only 11% in the superlight usage category. Toward the other end of the spectrum, 35% percent of Android users can be defined as “heavy users,” using applications more than 50 times per month, compared to only 15% on the iPhone.
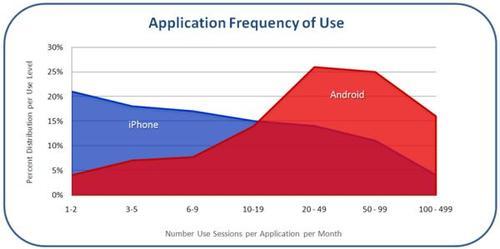
We believe differences in frequency of use are driven by the same underlying factors affecting length of use; namely, fewer available applications for Android and different behaviors exhibited by an older, more tech savvy user base. Overall this creates opportunities for Android application developers who are seeing saturation in the iPhone App store. Finally, a lot will hinge on the Android Market becoming a better shopping experience as well as the need for better design of upcoming Android OEM handsets than the existing HTC G1.