Each month, Flurry leverages its data set collected from iPhone, Android, BlackBerry and J2ME applications to identify, study and share industry trends. Flurry tracks over 20,000 live applications and over 2 billion user sessions each month. Applications that include Flurry Analytics have been downloaded to more than 80% of all iPhone, iPod Touch and Android devices. Additionally, each day, approximately one of out every five downloaded applications from the App Store and Android Market include Flurry Analytics. The Pulse report is generated in the first half of each month, looking back at data up through the previous month. Different than other reports that provide updates to the same set of statistics each month, Flurry explores different business themes and topical issues relevant to mobile developers and other industry players.
I. For iPhone and Android, Content is King
Applications are becoming the dominant delivery mechanism for content, entertainment and tools on smartphones. Last fall, Flurry released a study on user retention across all application categories, shedding light on application pricing and business models. In this report, Flurry takes a deeper look at consumer loyalty and engagement metrics across the largest application categories, comparing application user behavior on iPhone and Android platforms.
For this study, Flurry identified the top applications among a set of the largest categories across the App Store and Android Market: Games, Entertainment, Social Networking, News and Lifestyle. In total, approximately 100 applications were evaluated over a six month period, totaling more than 800 million user sessions.
Flurry studied (1) user retention (2) user session frequency and (3) user session lengths over a six month period. The chart below shows the average retention by month, over a six month period, for all sampled iPhone versus Android applications.
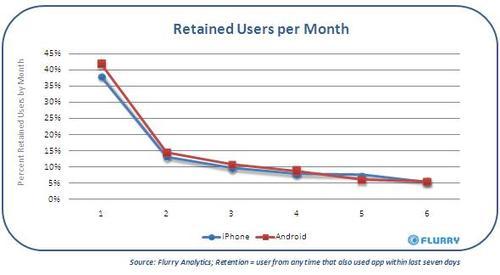
Retention curves between aggregated iPhone and Android applications were nearly identical. We believe underlying reasons include the fact that Android handsets are capturing a more mainstream audience similar to the iPhone and that Android handsets have improved relative to the iPhone handset (e.g., featuring advanced, large touch screen interfaces with ample processing power). Finally, we observe that more developers are creating both Android and iPhone versions for the same application. For this analysis, roughly 20% of the sample we pulled included versions of the same application on each platform.
The next two charts compare session lengths and frequency of use per category, and per platform:
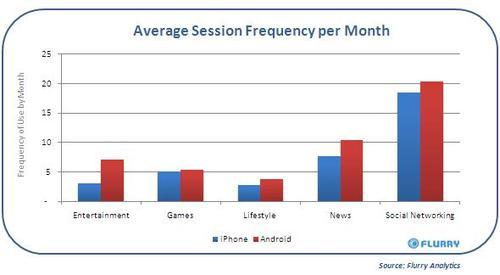
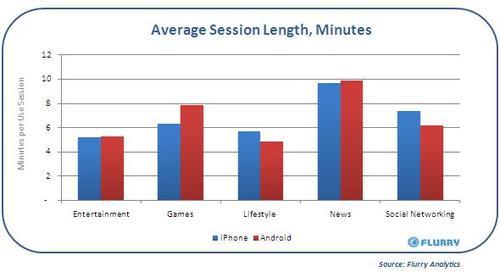
Reviewing consumer engagement metrics of session frequency and session length across key categories on iPhone and Android, Flurry again found little variance. We conclude that mobile applications have reached a new stage of maturity, where apps perform similarly across platforms. Our ultimate conclusion is that the content trumps the platform. Just like the brand of flat screen T.V. doesn’t affect how much one enjoys a movie she is watching, the new class of touch screen smartphones doesn’t impact how well the user enjoys a game, social networking or other kind of application.
II. The iPad Effect: Developer Support Explodes
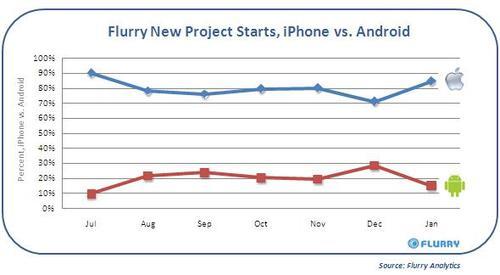
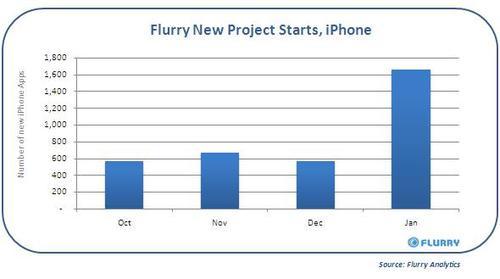
Developers integrating Flurry analytics into iPhone OS applications in January increased by nearly three times over December. This represents the single largest spike in Flurry history, with over 1,600 new iPhone OS application starts for January. Historically, Flurry has measured surges in new application starts within its system in anticipation of new device launches, including for the Motorola Droid and iPhone 3GS. As such, we hypothesize that excitement generated by Apple’s iPad event in January is driving this growth. For developers who get a jump on customizing their applications for the iPad, there may be an opportunity to stand out early on, and earn more downloads.
Android new application starts are also growing, showing a steady ramp for the second half of 2009 and for January 2010. Over this time period, month-over-month growth has averaged approximately 25%.
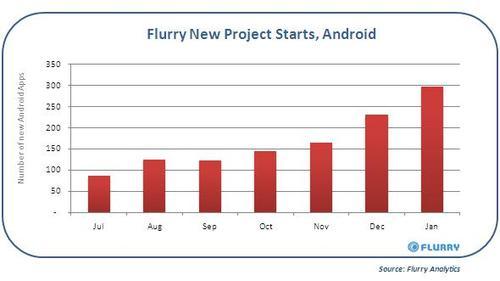
Flurry measures the relative support developers dedicate to iPhone versus Android platforms by tracking new application starts within its system. While Android’s steady new application growth over the second half of 2009 closed the gap against the iPhone, reaching as many as one out of every three new applications starts within Flurry for December, the recent spike in Apple iPad support has swung the pendulum back in Apple’s favor to a level not seen at Flurry in six months. The unprecedented surge in support for iPad is a positive early indicator for its commercial potential.