By: Lali Kesiraju, Marketing and Analytics Manager
In 2013, we reported that China surpassed the US in the number of active mobile phones and tablets. While the number of devices (that Flurry tracks) in both countries grew - US by 86% and China by 74%, China is still leading the way. We decided to take a peek at how the mobile activity in China has changed over the years. Flurry now tracks 425 Million devices in China and the Flurry SDK resides in 33,000 apps developed by 7,350 companies based in China.
Year-over-year growth from 2014 to 2015 in overall session activity in China is 23%, with China representing close to 10% of all Flurry-tracked sessions. While the growth seems to be low compared to the global growth of 58% year-over-year, this comes at no surprise given China is a mature market for mobile devices. Global growth is driven by developing countries like Brazil (134%), Indonesia (176%), and India (92%).
Fitness and Photos at Their Fingertips
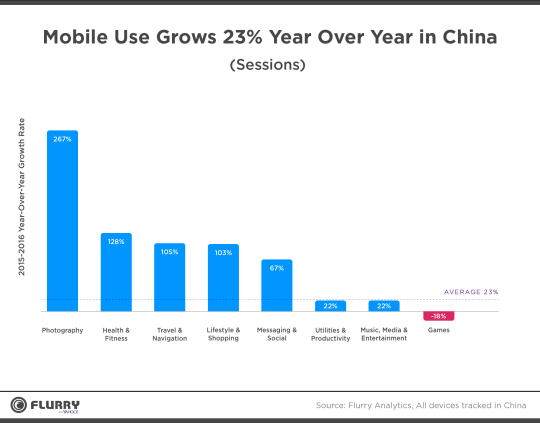
Photography, Health & Fitness, and Travel & Shopping apps saw triple digit growth in sessions. While it may come at no surprise that photography apps saw the most growth year-over-year, with an increase of 267%, Chinese mobile consumers are also becoming more health conscious, with Health & Fitness apps seeing substantial growth (128% YoY). This may be attributed to China’s early adoption of wearable tech and wellness tracking, with some estimating over one million Apple Watch units purchased in the country between April 2015 and August 2015.
What’s more, Lifestyle & Shopping growth in China is also outpacing global growth (103% YoY vs. 81% YoY) showing Chinese consumers are on the forefront of m-commerce.
Although Games saw a decline in session activity throughout the last year, it is still the largest driver in sessions overall. The Games category accounts for 17% of total sessions in China in 2015. This statistic combined with Niko Partners’ report that China’s mobile gaming spend in 2015 is $5.5 billion (the highest by any country in the world) affirms that gamers in mature markets prefer to “pay instead of play.”
Chinese Users Drive Phablet Shift
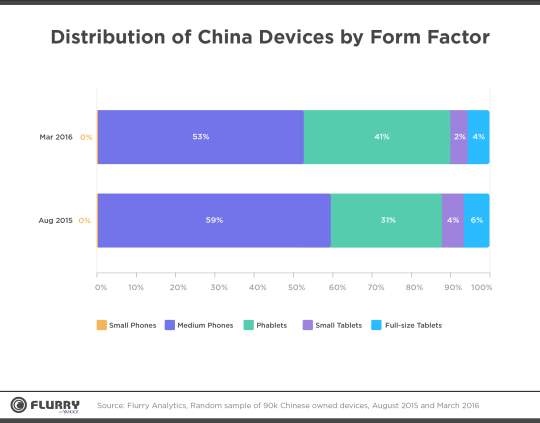
Our analysis shows that China is ahead of the game in phablet adoption and is leading the phablet revolution. Phablets are cannibalizing all other form factors in China and their share grew from 31% in August 2015 to 41% in March 2016. This supports our estimation in January that phablets will account for over 50% of mobile devices in the world by the end of 2016. Perhaps even more staggering is phablet adoption increasing by 32% in just the last 7 months alone.
Consumer Segments that Count
Understanding the Chinese consumer is critical to understand global trends. The top Personas that Chinese users fall in are Photo & Video Enthusiasts, Casual & Social Gamers, Health & Fitness Enthusiasts and Cord Cutters.
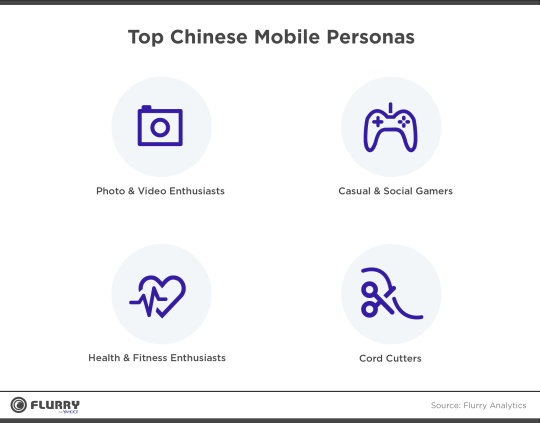
Chinese users are following US cord cutting trends. We’ve found that in addition to indexing high against the Cord Cutting Persona, the Media and Entertainment category dominates user’s time spent across both iOS and Android devices.
These four segments provide marketers key insight into how to reach Chinese consumers.
Chinese Consumers are the Crystal Ball
China continues to be our oracle for the future of global mobile growth and adoption. Chinese users are on the forefront of key mobile consumer trends and provide developers and advertisers the opportunity to capitalize on the cross section of emerging tech and media.