Flurry recently quantified China’s meteoric adoption of iOS and Android applications. While China ranked 10th in application sessions at the beginning of 2011, it finished the year in 2nd place, only behind the United States. With its large population and rapidly emerging middle class, adoption of apps vaulted China into the position of world’s 2nd largest app economy. In additional analysis, Flurry also determined that China has the most market upside, based on calculating those in China who can afford smartphones versus the current installed base.
This report reveals that, for the first time ever, China now leads in new smart device adoption (iOS and Android smartphones and tablets). We also update app usage velocity trends for China and the rest of the world, since first studying this late last year. For this report, Flurry used its entire data set, tracking more than 1 billion anonymous, aggregated application sessions per day. More than 60,000 companies use Flurry Analytics across more than 160,000 applications.
Let’s start with a look at the fastest growing countries, as measured by app session growth.
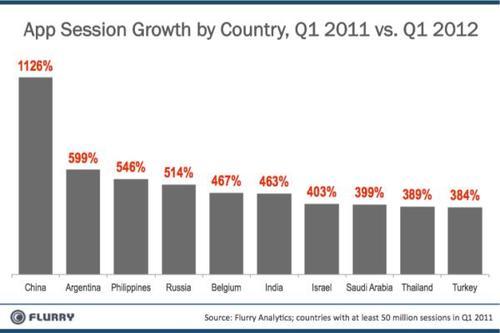
Comparing Q1 of 2011 versus Q1 2012, the chart above shows the ten fastest growing countries in terms of app sessions. A session is the launch and use of an application. For example, a consumer who opens a news application and then spends two minutes reading various articles counts as one session. Starting on the left, China leads the world in app session growth, with an enormous growth rate of more than 1100% between Q1 2011 and Q1 2012. China’s growth rate is particularly staggering given that it was already the world’s 7th largest country in terms of app sessions by the end of Q1 2011. This speaks to the country’s sheer population as well as increasing affluence among a meaningful part of its population. Please note that we project the last ten days of Q1 2012.
We next study new device activations between China and the U.S., with amazing results.
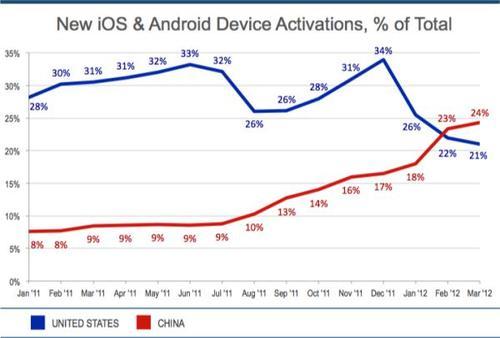
The above chart shows new iOS and Android device activations per month in the U.S. and China for the last 15 months, from January 2011 through March 2012. In January 2011, the U.S. accounted for 28% of the world’s total iOS and Android device activations, while China accounted for 8%. In February, Flurry calculated that China surpassed the United States in monthly new iOS and Android device activations for the first time in history. China is now the world’s fastest growing smart device market. For March, we project that China will account for 24% of all iOS and Android device activations, while the U.S. will account for 21%. Again, please note that we project the several days of March to round out Q1 2012.
With China now activating more devices per month than the U.S., this means that the gap is closing between the two countries in terms of installed base. Not only is China already the second largest app economy, but also could eventually overtake the U.S. as the country with the largest installed base of smart device users. We estimate that the U.S., a more mature market, currently has more than twice as many active devices than China. However, China, a faster growing, emerging market, already has twice as large an installed base as the next largest market, the UK.
In this last chart, Flurry looks at the shift in application usage across the world.
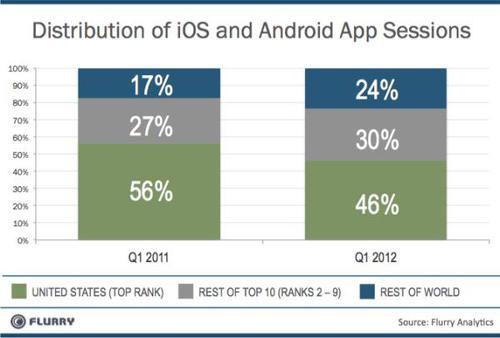
The chart above compares mobile app sessions tracked by Flurry Analytics in Q1 2011 versus Q1 2012. The green area shows the percent of app sessions occurring in the United States, the leading mobile app market. While the absolute number of sessions in the U.S. has more than doubled between Q1 2011 and Q1 2012, its share of total sessions has declined from 56% to 46%. In other words, while the U.S. app market is growing rapidly, the rest of the world is growing even faster. Looking at the balance of the top 10 countries (ranks 2 – 10: China, UK, South Korea, France, Australia, Canada, Japan, Germany and Spain), this group has increased in collective sessions by 3.4 times between Q1 2011 and Q1 2012, resulting in an increase in total session-share from 27% to 30%. Further, the rest of the world (another 217 countries across which Flurry tracks user sessions), has grown by more than 4 times, increasing in session-share from 17% to 24%.
No matter how we slice it, the application market continues to grow at unprecedented rates, and increasingly across more borders. With smart devices adoption rates more than four times greater than those witnessed during the 1980s PC revolution and twice as great as those seen during the 1990s Internet Boom, no other consumer technology has been more accessible than smart device application software. It’s literally taking over the world.