According to IBM, two out of five online retail visits in the U.S. on Black Friday were made from mobile devices, directly generating more than 20% of online retail sales. On Thanksgiving Day, smartphones and tablets accounted for an even greater share of online retail visits and sales (43% of visits and 26% of sales). These results show the extent to which connected devices now influence retail sales, but Flurry’s own Thanksgiving weekend data demonstrates that our relationships with our smartphones and tablets go well beyond picking up a Black Friday deal while picking at Thanksgiving leftovers.
App usage overall in the U.S. spiked by 25% on Thanksgiving compared to the previous Thursday, and not just as a result of shopping app use. The overall pattern of app usage over the Thanksgiving weekend demonstrates that smartphones and tablets have become the first truly personal computers, changing their function as we change our routines. To illustrate that point in this post, we take an in-depth look at U.S. app session starts from the day before Thanksgiving through to Cyber Monday. We compare Thanksgiving week to the week prior, and also compare those time periods for the two previous years. (By including the weekends prior to Thanksgiving for each year we can distinguish between overall growth in app usage and use that is unique to Thanksgiving weekend.)
The chart below provides a high-level view of how overall app usage has changed from year to year, and changes between the week prior to Thanksgiving and the week of Thanksgiving. The gaps between the green, blue, and gray pairs of lines illustrate the extent to which app usage in the United States has grown year over year, with baseline usage the week before Thanksgiving up by about two-thirds compared to the same time last year, and about triple what it was during November of 2011.
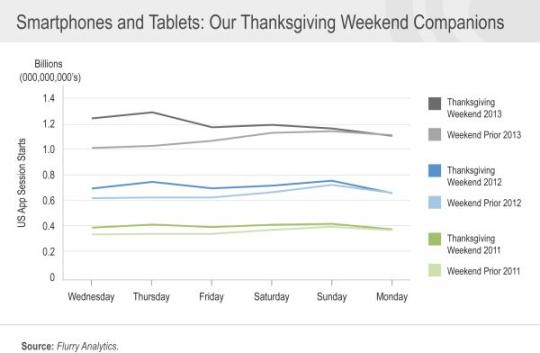
The darker line in each color pair shows Thanksgiving weekend for a particular year while the lighter version shows the prior weekend for that year. The gap between the lighter and the darker lines in a color pair shows the difference in app usage by day between Thanksgiving weekend and the prior weekend. For the past three years, that difference has been greatest on Thanksgiving Day, diminishing to return to normal by Cyber Monday. In 2011 and 2012, U.S. app usage spiked by 20% on Thanksgiving Day compared to the previous Thursday. This year the Thanksgiving spike grew to 25%.
Given mobile devices are so personal, it’s no surprise that they tag along as we enjoy Thanksgiving weekend, but we wanted to understand the drivers behind the Thanksgiving spike in app usage. Is it just mobile shopping? Recipe apps aiding Thanksgiving cooks? Football fans checking stats from the couch? Social networking apps used to stay in touch with family far away? What accounts for the extra app sessions on Thanksgiving?
To find out, we compared app sessions by category for Thanksgiving weekend to the weekend before, focusing on the three days for which there is the biggest difference in overall app use.
The results are shown in the table below. The rows are app categories aggregated across operating systems. The columns show changes in app usage between Thanksgiving week and the same day the previous week for each category. Each cell shows that same comparison between Thanksgiving week and the previous week for the past three years.
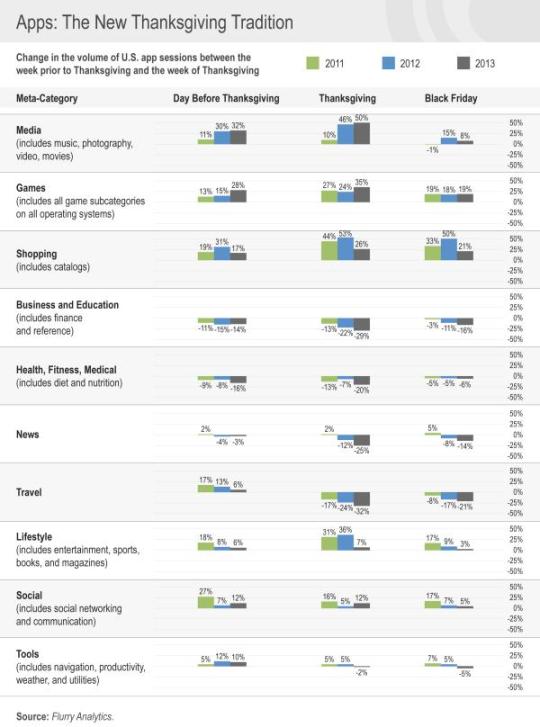
For obvious reasons, shopping apps consistently spike over the Thanksgiving period. Interestingly the bump this year wasn’t as large as the one last year; however that should not be interpreted to mean that enthusiasm for shopping apps is waning. On the contrary, between 2012 and 2013, overall use of shopping apps in the week before Thanksgiving grew by about 70%, so the 2013 Thanksgiving spike comes on top of a higher baseline usage level.
App categories beyond shopping that saw spikes in app usage during Thanksgiving week are fairly predictable. Media spiked on Thanksgiving Day in particular – most likely in part because it includes photo and video apps used to record family gatherings. It was also somewhat higher on Wednesday and Friday compared to the previous week.
More time for relaxation probably explains why game apps, which are always popular, enjoyed even more use over the Thanksgiving period than the week before.
What types of apps experience less use on Thanksgiving and the days immediately before and after than during the previous week? Mainly apps associated with things people take a break from over the Thanksgiving holiday: business and education, health, and news.
Travel apps also experience a decline in use Thanksgiving Day and the day after. That may seem counter-intuitive since Thanksgiving weekend is one of the busiest travel periods of the year; however it’s important to remember that people tend to be traveling to familiar places and often staying with relatives or friends so are less likely to need apps for booking hotels and rental cars or finding their way around an unfamiliar city.
So shopping does contribute to the spike in app activity on Thanksgiving, but it’s only part of the explanation. This data shows the extent to which smartphones and tablets have become our constant companions, morphing their function to our whims and circumstances in ways even laptops never really did. They are truly our most personal computers. Sure, you can use them to shop without getting out of bed, let alone braving crowds at the mall, but your device can also entertain you with games, music, and movies. It can even tell you how far you need to walk to make up for that second helping of mashed potatoes – if you choose to look.