App developers must find new opportunities to delight app users while also increasing an app’s profitability. And on top of creating an engaging user experience, driving user acquisition, or finding new ways to monetize, the ability to quickly resolve crash incidents is essential for sustaining a positive user experience.
Flurry Crash Analytics simplifies identifying and responding to crashes, errors, and exceptions in a mobile app. It does so by giving you, the app developer, the tools to completely reconstruct the crash (bug) in order to isolate its cause. Although the basic setup to get the crash information is easy, the enhanced setup requires a bit of additional planning, but it allows you to harness the full power of Flurry Crash analytics.
When fully leveraged, the Flurry Crash Analytics UI displays the events, breadcrumbs, and crash details in a single time ordered list capturing all pieces of information related to the session in which the crash occurred. This unified view can provide sufficient information required to reproduce the steps that led to a crash and as such can be of great help when improving the code to address the reported crash.
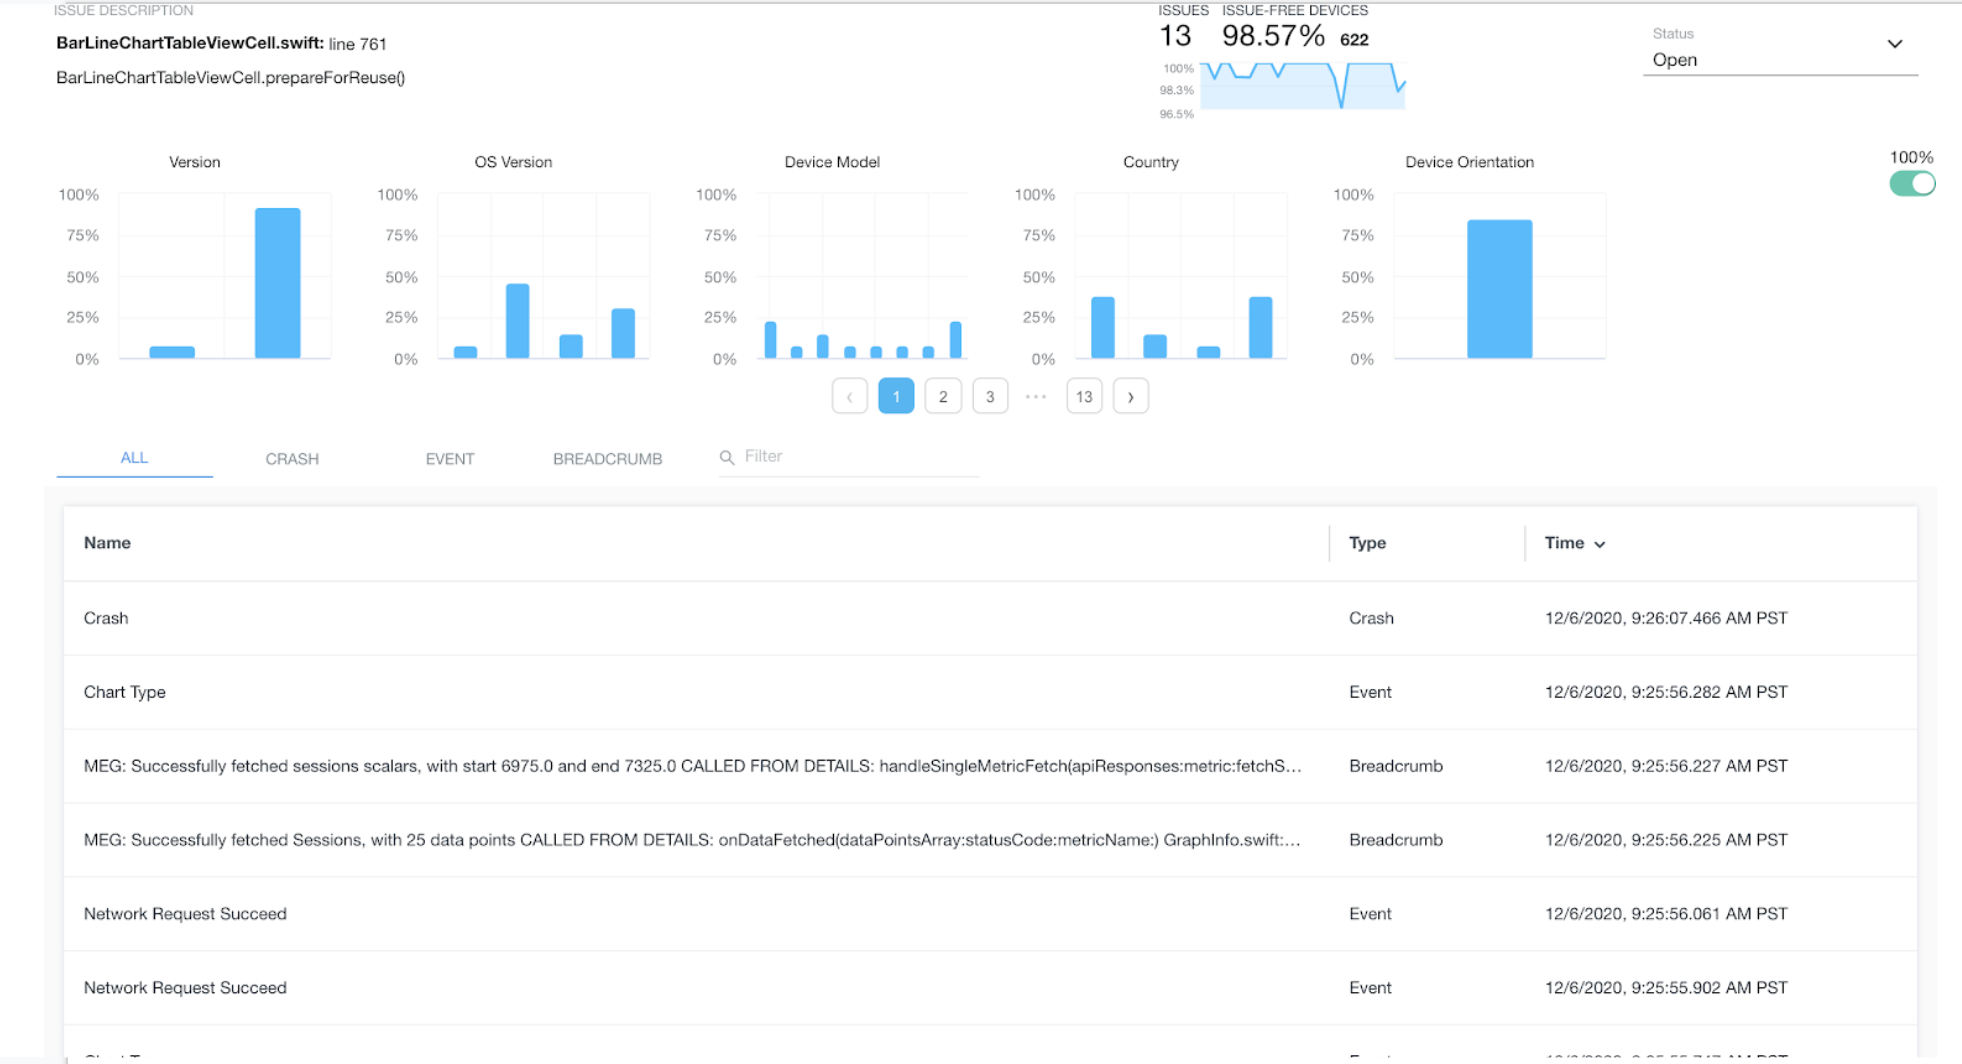
Fig. 1: The Flurry Crash Analytics user interface displays the events, breadcrumbs, and crash details in a list.
Getting Started with Flurry Crash for iOS & Android
Crash reporting is a standard feature of the Flurry Analytics SDK. In other words, integrating Flurry Crash Analytics does not require a separate SDK.
Getting started with Flurry Crash Analytics is easy. If your app is already integrated with Flurry, skip ahead to Step 3.
Step 1: Sign up for a free account and add your app to Flurry.
Step 2: Integrate Flurry’s SDK in about 5 minutes. You can do this via CocoaPods (iOS), jcenter (Android), or let us walk you through easy integration steps. Find step-by-step integration instructions for iOS, Android, React Native, or Unity in our documentation pages. Once you complete this step, your app’s data will flow into your Flurry dashboard.
Step 3: Enable Flurry Crash with an additional line of code:
iOS: In iOS, only a single crash processor can be active. For this reason, the Flurry Analytics SDK does not enable crash by default and requires you to enable it explicitly.
ObjectiveC example:
FlurrySessionBuilder* builder = [[FlurrySessionBuilder new]
                                 withCrashReporting:YES];
[Flurry startSession:flurryAPIKey withSessionBuilder:builder];
Android: On Android, Crash Analytics is enabled by default and requires no explicit call to send Crashes to Flurry Analytics. This means that data for your Android apps is already flowing into Flurry Crash Analytics. For Caught Exceptions and Logged Errors, you can optionally update your error handling methods, with the method call below, to log these issues into Flurry:
new FlurryAgent.Builder()
        ...
        .withCaptureUncaughtExceptions(true)
        ...
        .build(this, FLURRY_API_KEY);
React Native:
new FlurryAgent.Builder()
        ...
        .withCrashReporting(true)
        ...
        .build(FLURRY_ANDROID_API_KEY, FLURRY_IOS_API_KEY);
Unity:
      new Flurry.Builder()
                  .WithCrashReporting(true)
                  ...
                  .Build(FLURRY_API_KEY);
With this basic setup, the Flurry Dashboard will be reporting on all the crashes in your app.
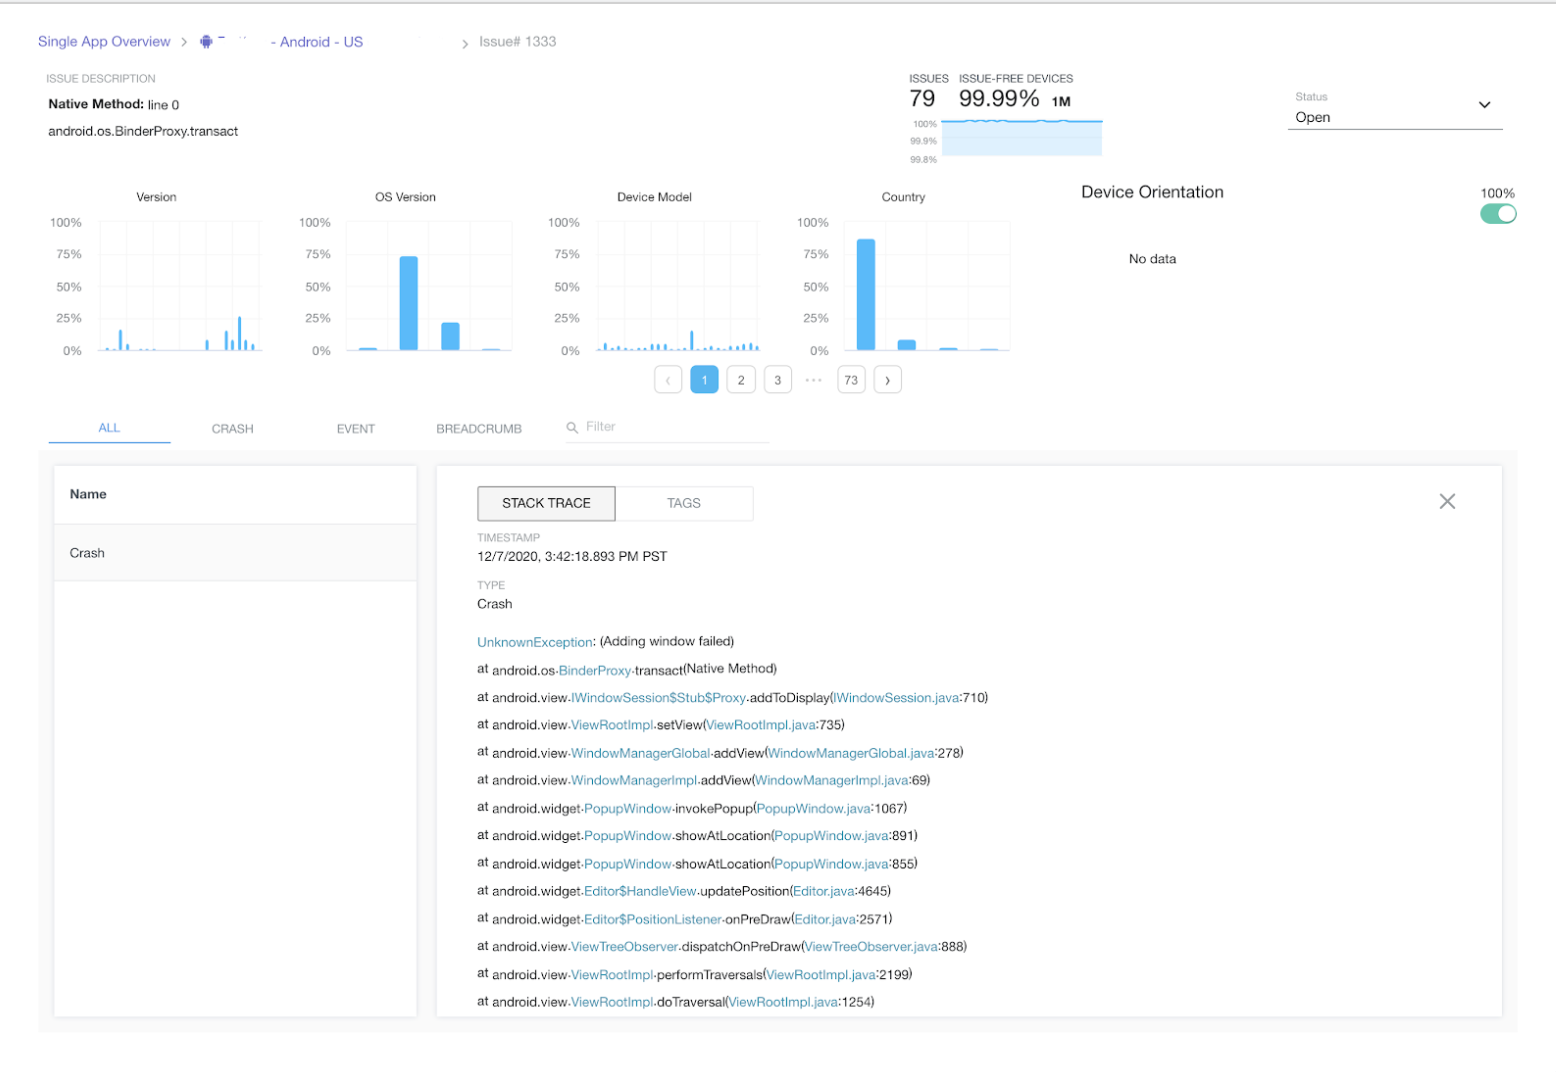
Fig. 2: With basic setup complete on iOS or Android, the Flurry Dashboard will be reporting on all the crashes in your app.
Journey to Crash: How to Log the Events Leading Up to a Crash
To help developers efficiently isolate the causes of the app crash and to resolve the bug that resulted in the crash, Flurry Crash Analytics exposes the additional features: the upload of the mapping files and Breadcrumbs. Flurry Crash Analytics creates a Journey to Crash - the time ordered list capturing all the steps that led to the crash. In addition, it combines all the CustomEvents logged within the app prior to the crash.
Mapping Files Upload
To get details of every crash, error, and exception, including the number of occurrences and the detailed stack trace, upload your dSYM or Proguard mapping files in the Single App Overview section.
You can also integrate the mapping file upload with your development workflow. The scripts to do so, for iOS and Android apps, are available on Flurry’s Github repository.
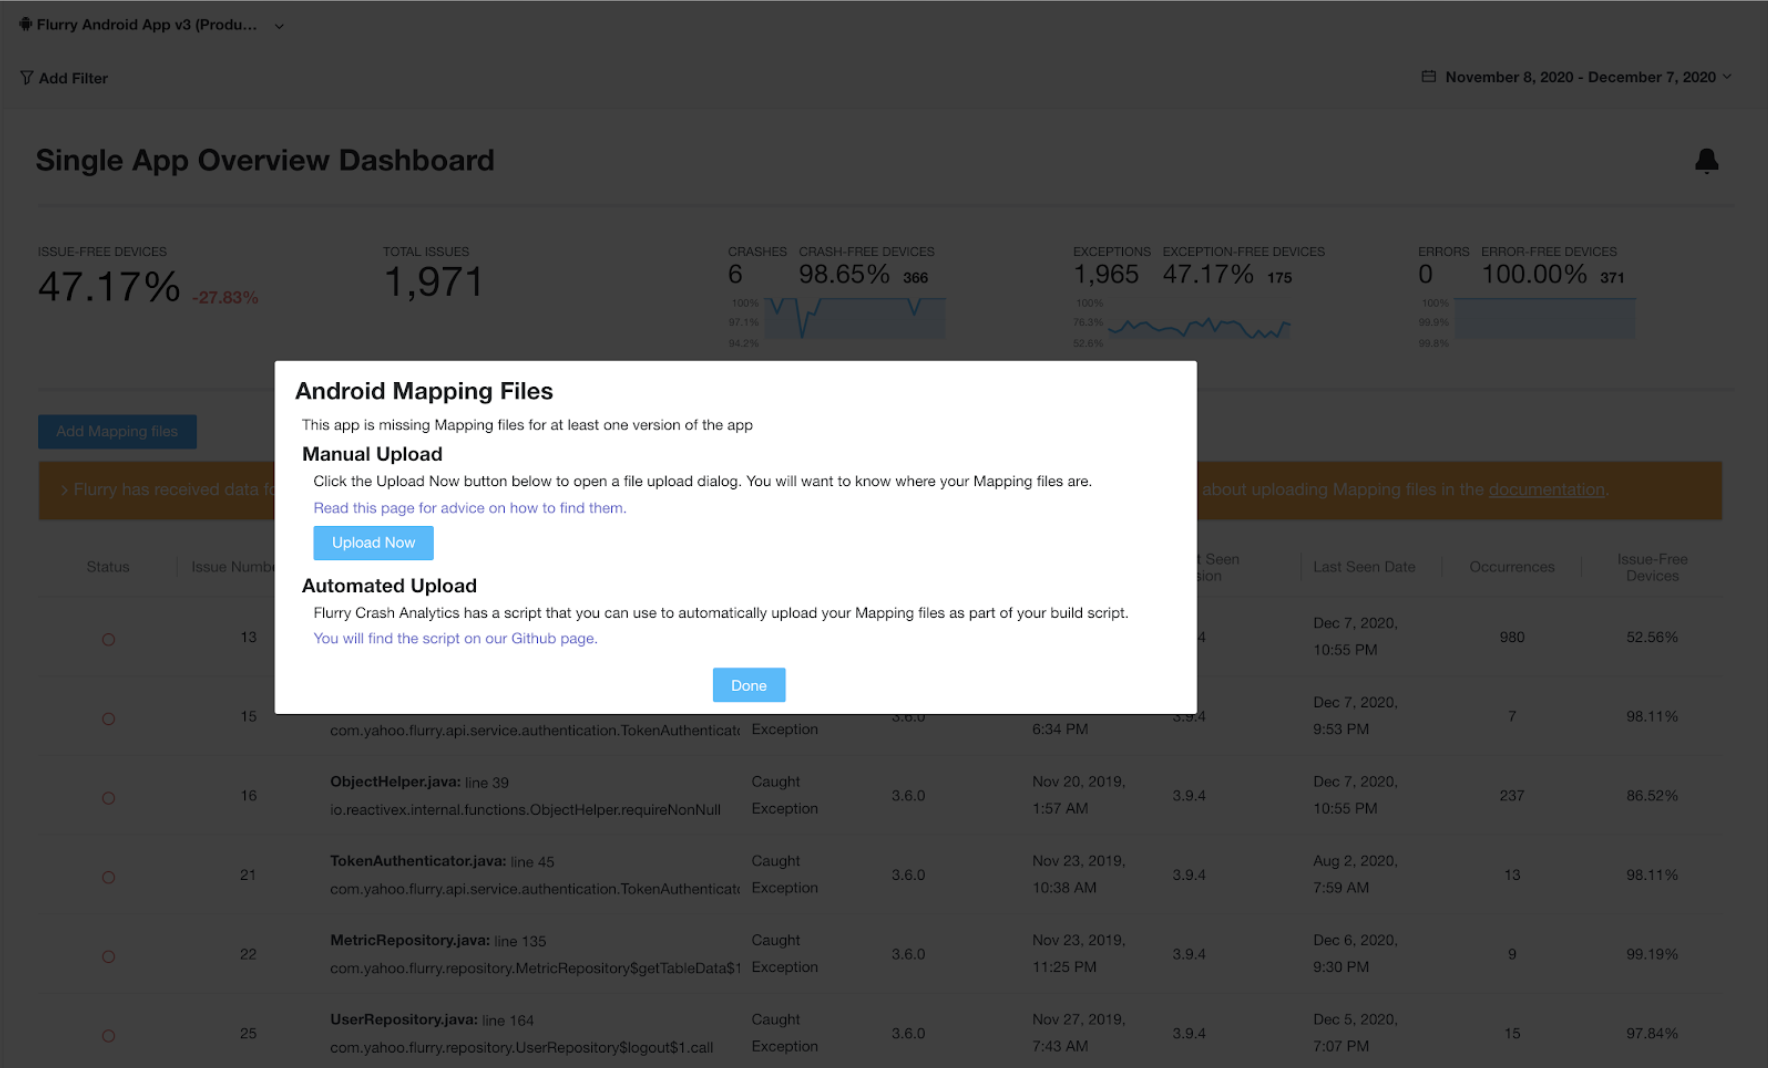
Fig. 3: Upload mapping files for iOS or Android apps to help developers efficiently isolate the causes of the app crash.
Breadcrumbs
As the name implies, the Breadcrumbs are just that, traces of information left throughout the app’s code to help trace the flow of events a user experienced leading up to the crash. The app developers leave the Breadcumbs throughout the code, capturing the valuable information to help themselves understand the execution of code outside of what's recorded in the stack trace. Knowing the sequence of things the user did within the app before it crashed, helps developers reproduce the crash and diagnose the problem.
Add the breadcrumbs throughout your code using the Flurry SDK API to log the breadcrumbs:
Android:
FlurryAgent.logBreadcrumb(BREADCRUMB_ERROR_MESSAGE);
iOS:
[Flurry leaveBreadcrumb:@"BREADCRUMB_ERROR_MESSAGE"];
Custom Events
To enhance crash reporting and identify exactly where crashes occur in your app, integrate custom events. With custom events integrated, you will unlock endless possibilities to analyze your app’s audience and how your users use your app. For step-by-step instructions, please visit our documentation pages for iOS and Android.
Real Time Crash Analytics & Reporting!
Flurry Crash Analytics gives you a number of tools to tune into the crashes as soon as they are happening.
Realtime Crash Dashboard is, just as the name implies—a real time numerical chart of the crashes happening without specific details as to what those crashes are.
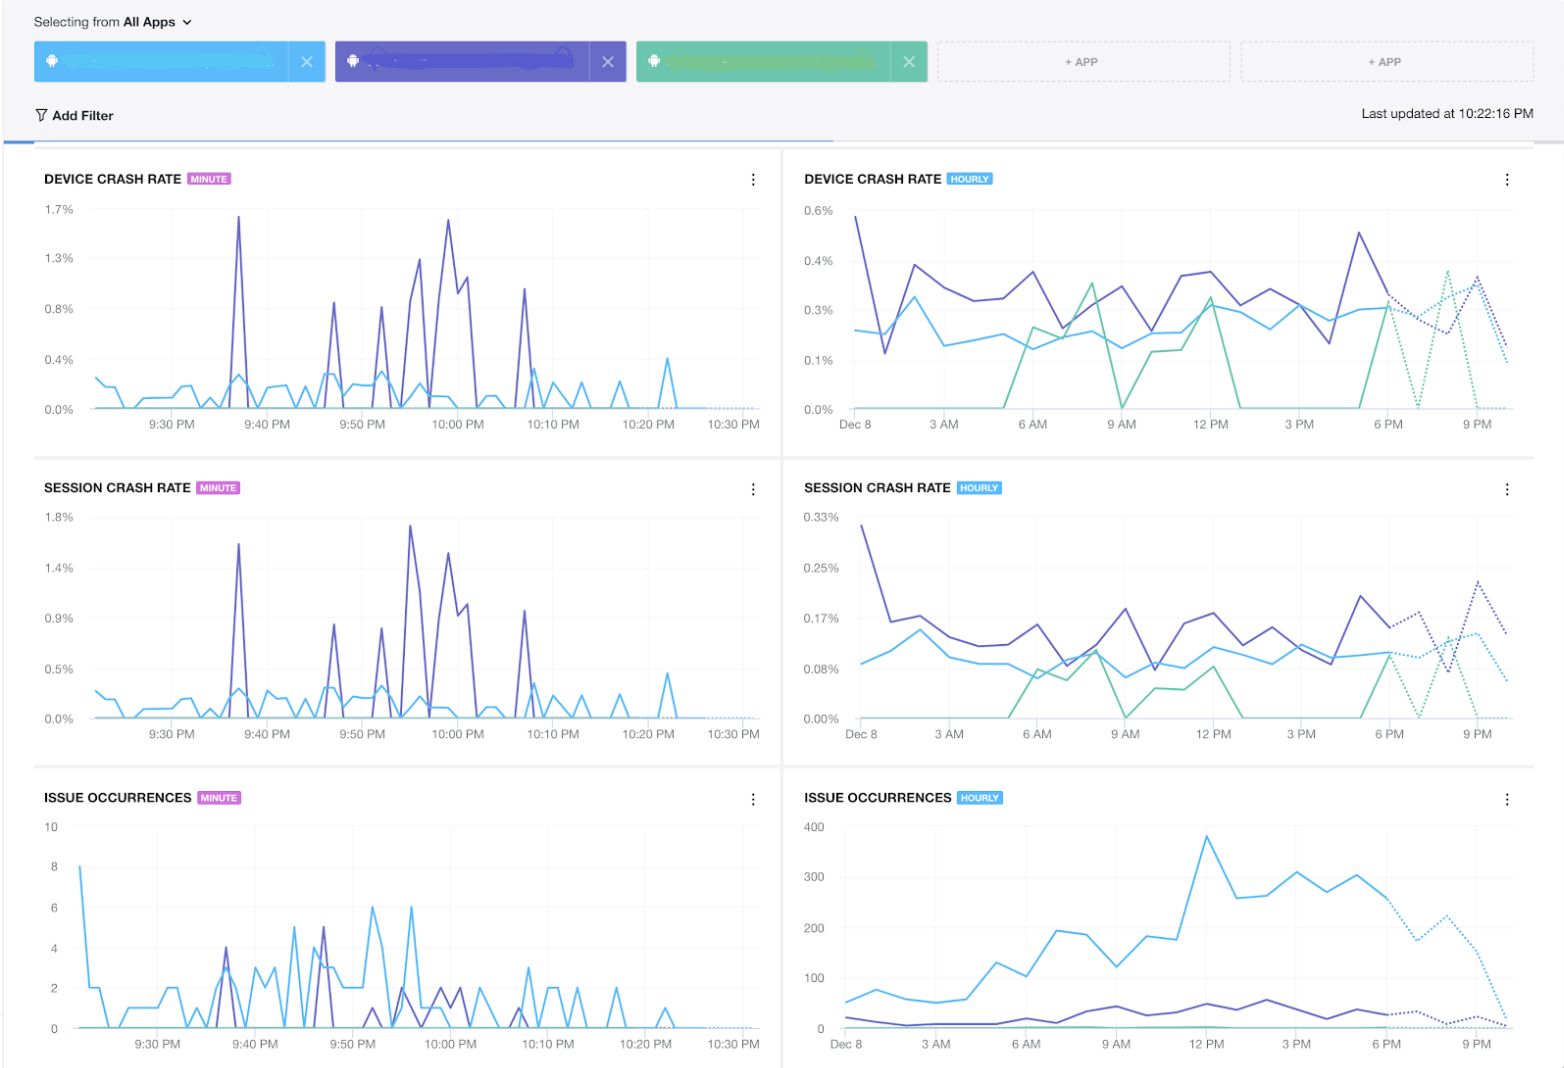
Fig. 4: Flurry’s Realtime Crash Dashboard reports app crashes in real time.
To dig deeper and to get the accurate, timely information of the crashes as they are happening in real time, there are further options:
Jira Integration
Integrate your Jira Cloud instance and Flurry Crash Analytics will automatically create a ticket in your Jira instance as soon as a crash occurs, for the first time.
Slack Integration
Similarly to Jira Integration, after you provide Flurry with the webhook URL of the slack channels where the alerts are to be delivered, Flurry Crash Analytics will be sending all the new crash incidents to that slack channel.
Crash Alerts (email, Slack, and push notifications)
You can monitor crash occurrences, such as Total Errors, Symbolicated Crash Devices, Symbolicated Crash Occurrences, Symbolicated Crash Impact Rate and receive alerts via email, Slack or - if you have the Flurry mobile app - as push notifications.
Visit Flurry’s Crash dashboard to begin reviewing and addressing the individual crashes in your app. You are now all set to manage and respond to crashes, errors and exceptions in your mobile app. Please see our documentation pages for more detailed information or reach out to us at support@flurry.com with any additional questions.