Building a Custom Dashboard in Flurry Analytics is not only simple, but it takes just a few seconds and will save you time in the future when you need to review the product metrics that matter for your business. You can create unlimited dashboards, each with a specific audience or feature in mind.
- Step 1: On any report measuring app sessions, activity, or event data, click the star icon in the top right corner.
- Step 2: In the drop-down menu, you can name the report and either save it to an existing dashboard or create a new dashboard. Note that you can save a report to multiple dashboards.
- Step 3: Easily access your dashboards by clicking the star icon in Flurry’s left hand navigation menu.
For example, many customers have created separate dashboards to measure iOS apps and Android apps separately, or dashboards by region or territory.

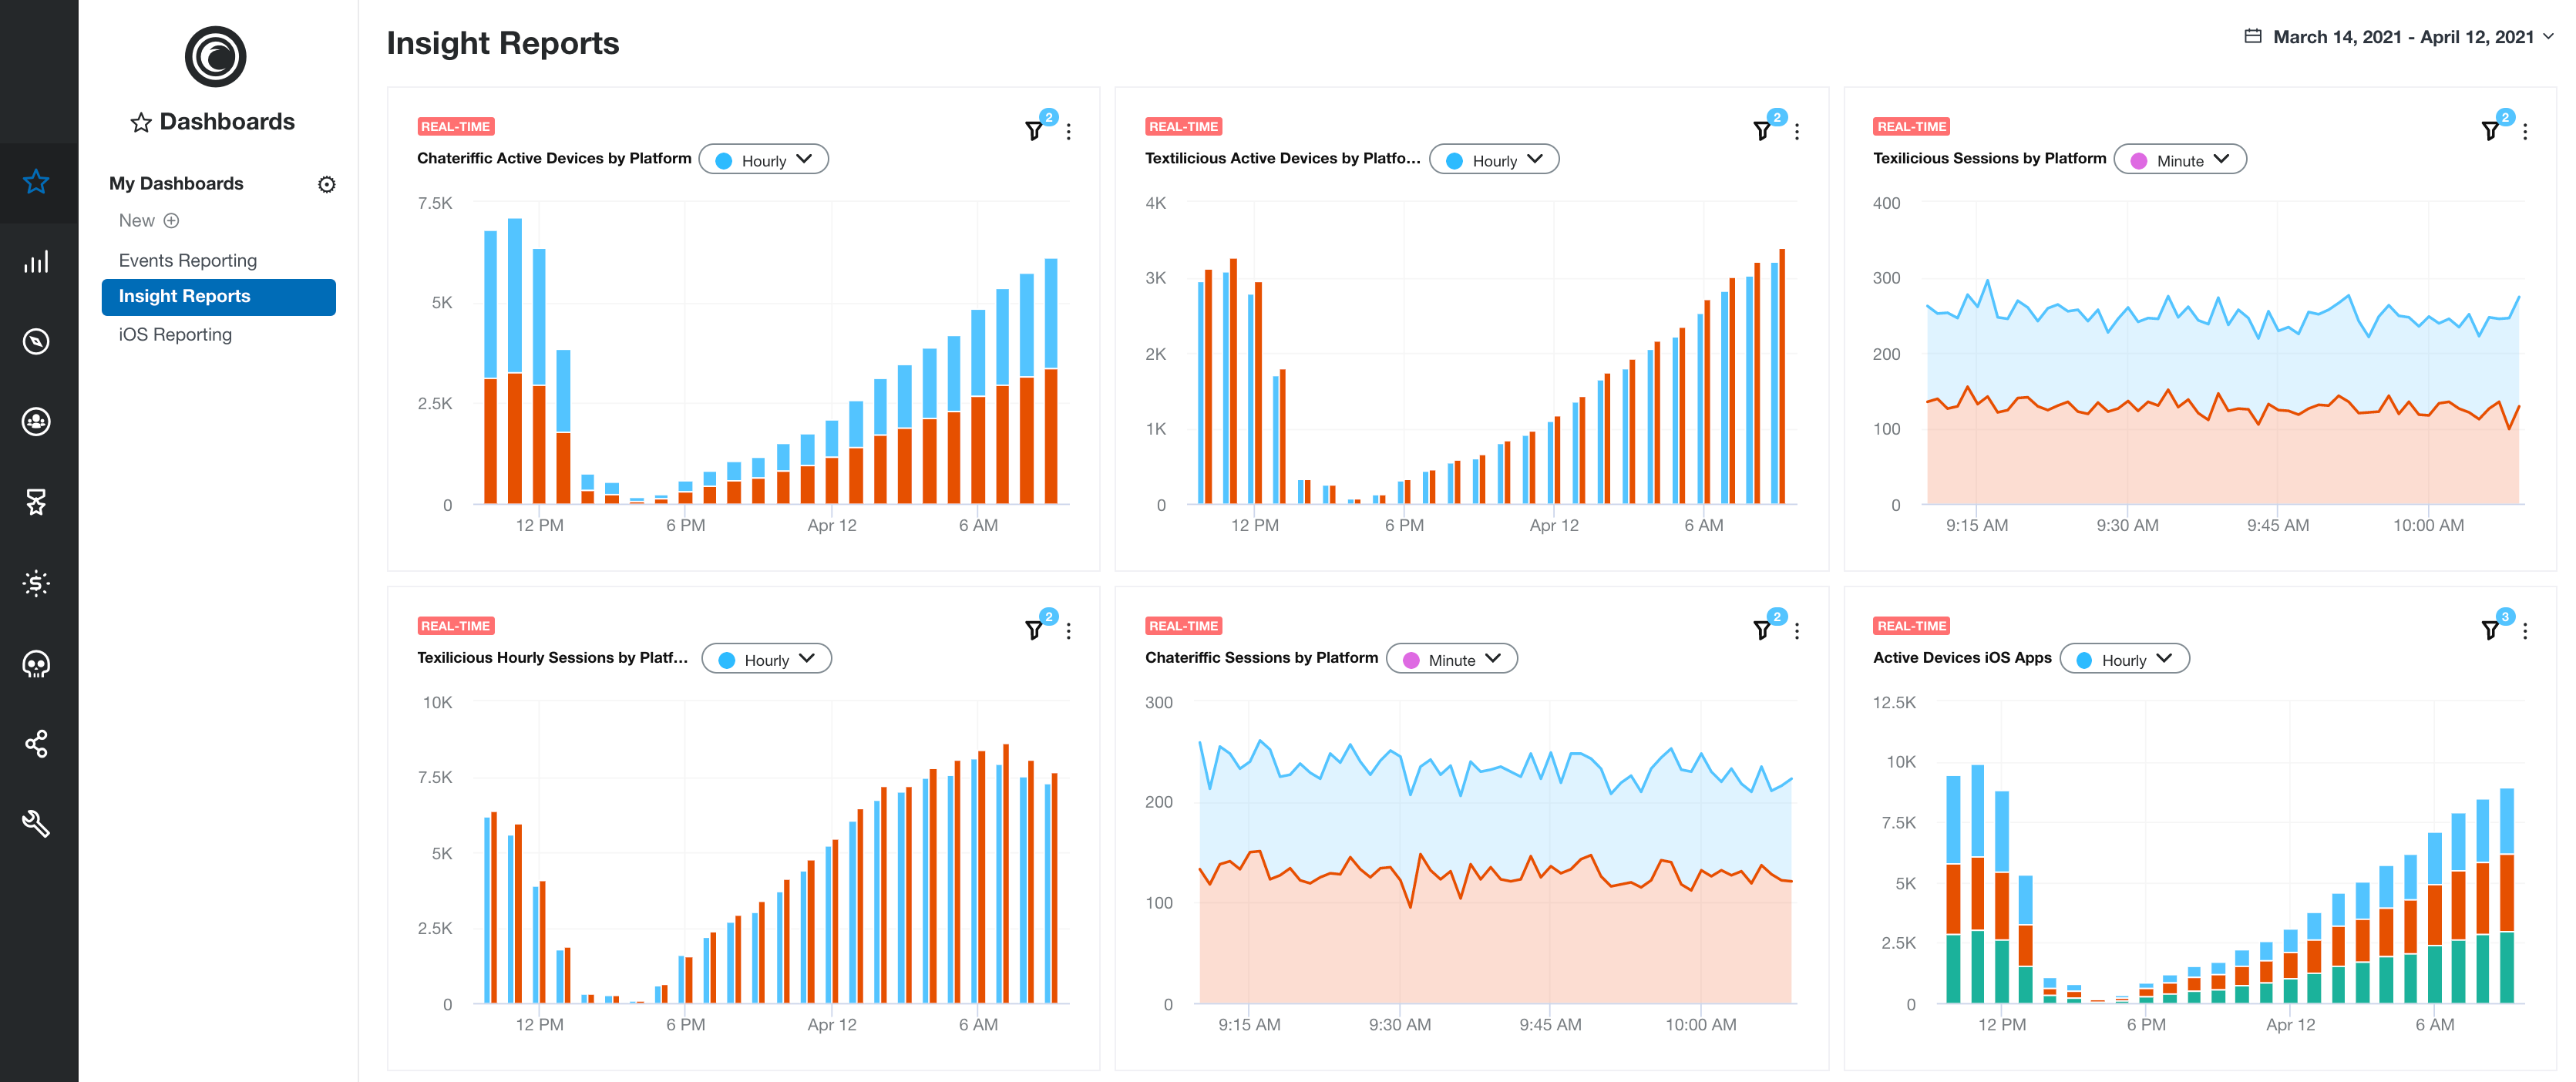
To view your custom dashboards, click the Dashboards icon--which is the star icon--on Flurry’s main navigation bar on the far left side of our developer portal. From there, you’ll be able to access all the different dashboards you have created.
Any dashboards created in the developer’s portal are automatically saved in the Flurry mobile app, and vice versa, meaning your most important metrics are with you on-the-go. Our goal at Flurry Analytics is to make product insights more accessible to app developers and help them build better apps that users love. Flurry Custom Dashboards are a new way for Flurry customers to conveniently view the product metrics they care about in one place. If you’ve used our new feature, we would love to hear from you. We welcome your feedback at support@flurry.com.