Today we launched the Flurry Debug Console—a new dashboard to track events for test devices. The Debug Console can help you conduct periodic integration testing to ensure that events are properly mapped and triggered with Flurry.
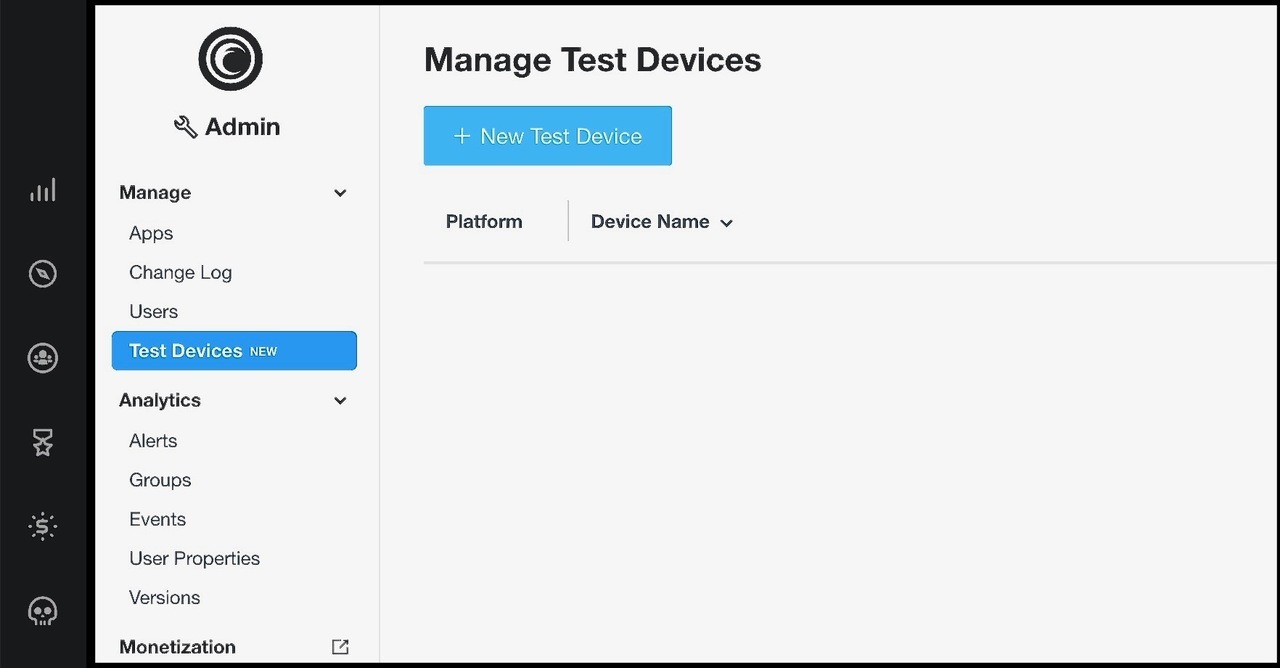
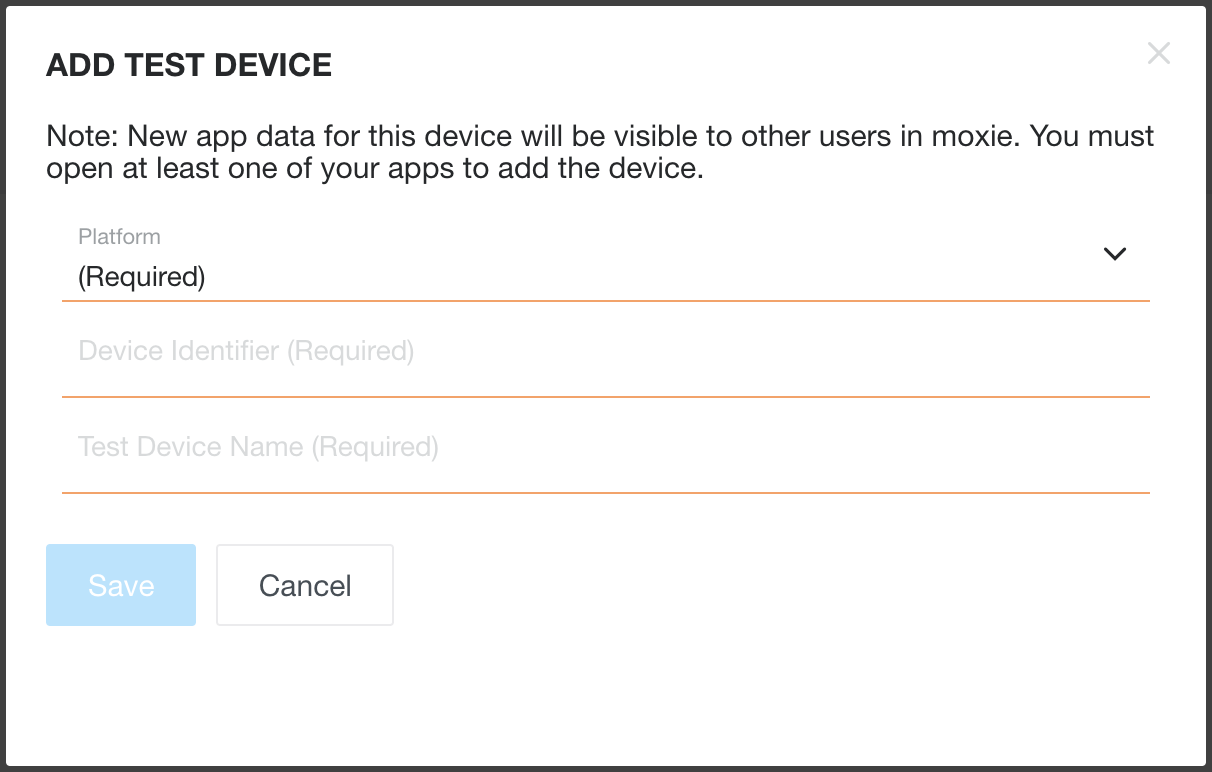
To use the Debug Console, you’ll need to add a Test Device. First, go to “Test Devices” in the Admin tab on the left navigation, and select “Test Devices” to enter and save your device information. You’ll need either your IDFA or IDFV for iOS devices and your Advertising ID for Android devices. If you don’t know these unique identifiers, you can find them by following these instructions .
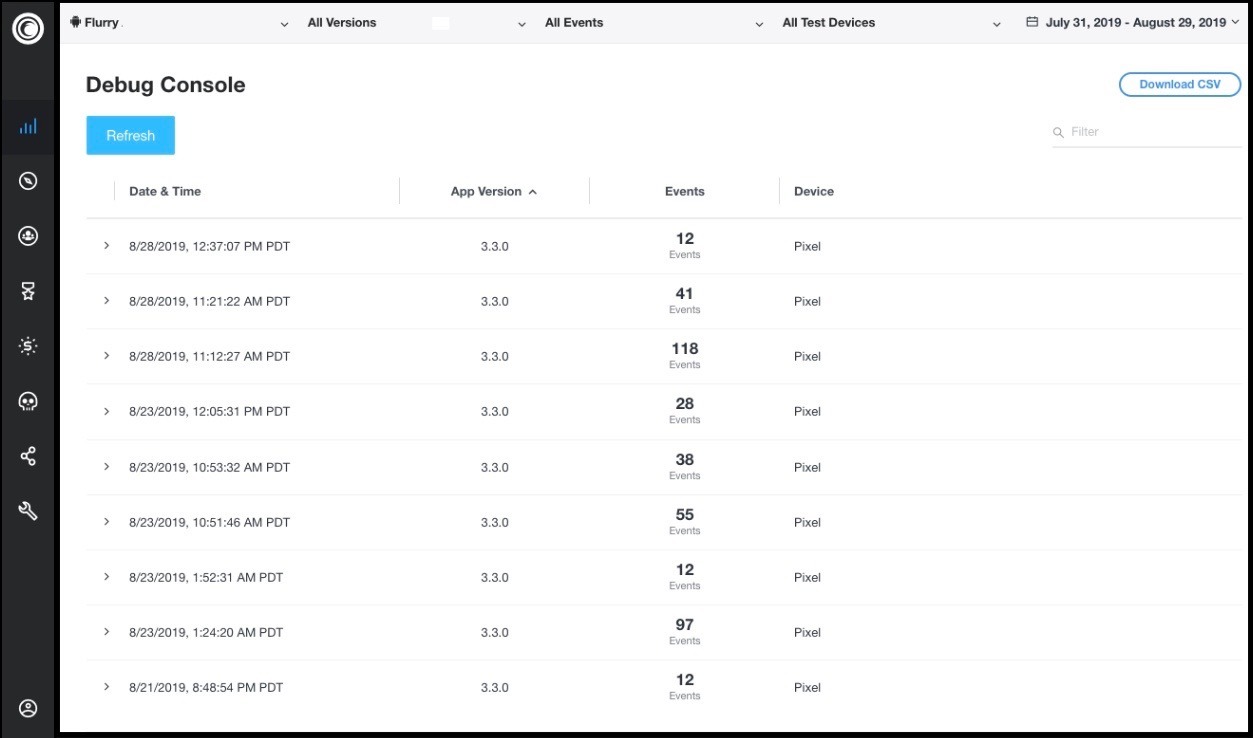
Next, you’ll need to open the app from your test device and trigger a few events. Finally, go to “Debug Console” in the Analytics tab on the left navigation to ensure that your test device properly triggered the events. While session data typically appears right away, data for new devices may take several minutes. Debug console will display session data for any test device beginning shortly after test device creation. You can filter this data by a specific event, version or test device.
For detailed step-by-step instructions, please see here.
If you have any suggestions or questions, please reach out at customersuccess@flurry.com.